

A Study of Exceptional Companies
The Owner's Memo #9; Just 4.3% of US stocks have produced all of the stock market's net wealth. The rest, in aggregate, have merely matched Treasury bills.

Reece Duca has run The Investment Group of Santa Barbara since 1968. During that time, he and his partners have never managed outside money, and they have grown Reece’s original, personal $75,000 stake to what is now reportedly several billion dollars.

I first learned about Duca through the excellent blog A Letter A Day by Kevin Gee. Kevin posted the transcript of an interview that Duca gave in 2023 in which he discusses his investment philosophy. In the interview, he stresses the importance of concentration in producing outsized investment returns and also emphasizes that there are a limited number of truly exceptional companies out there.
In driving home the latter point, Duca mentions a research study by Hendrik Bessembinder from Arizona State University. The study is called Do Stocks Outperform Treasury Bills?, and it was first posted on SSRN in 2017.

Bessembinder studied 25,332 companies over the 90-year period from 1926 to 2016, and he reported the dollar wealth generated by those companies.1 He found a few startling takeaways.
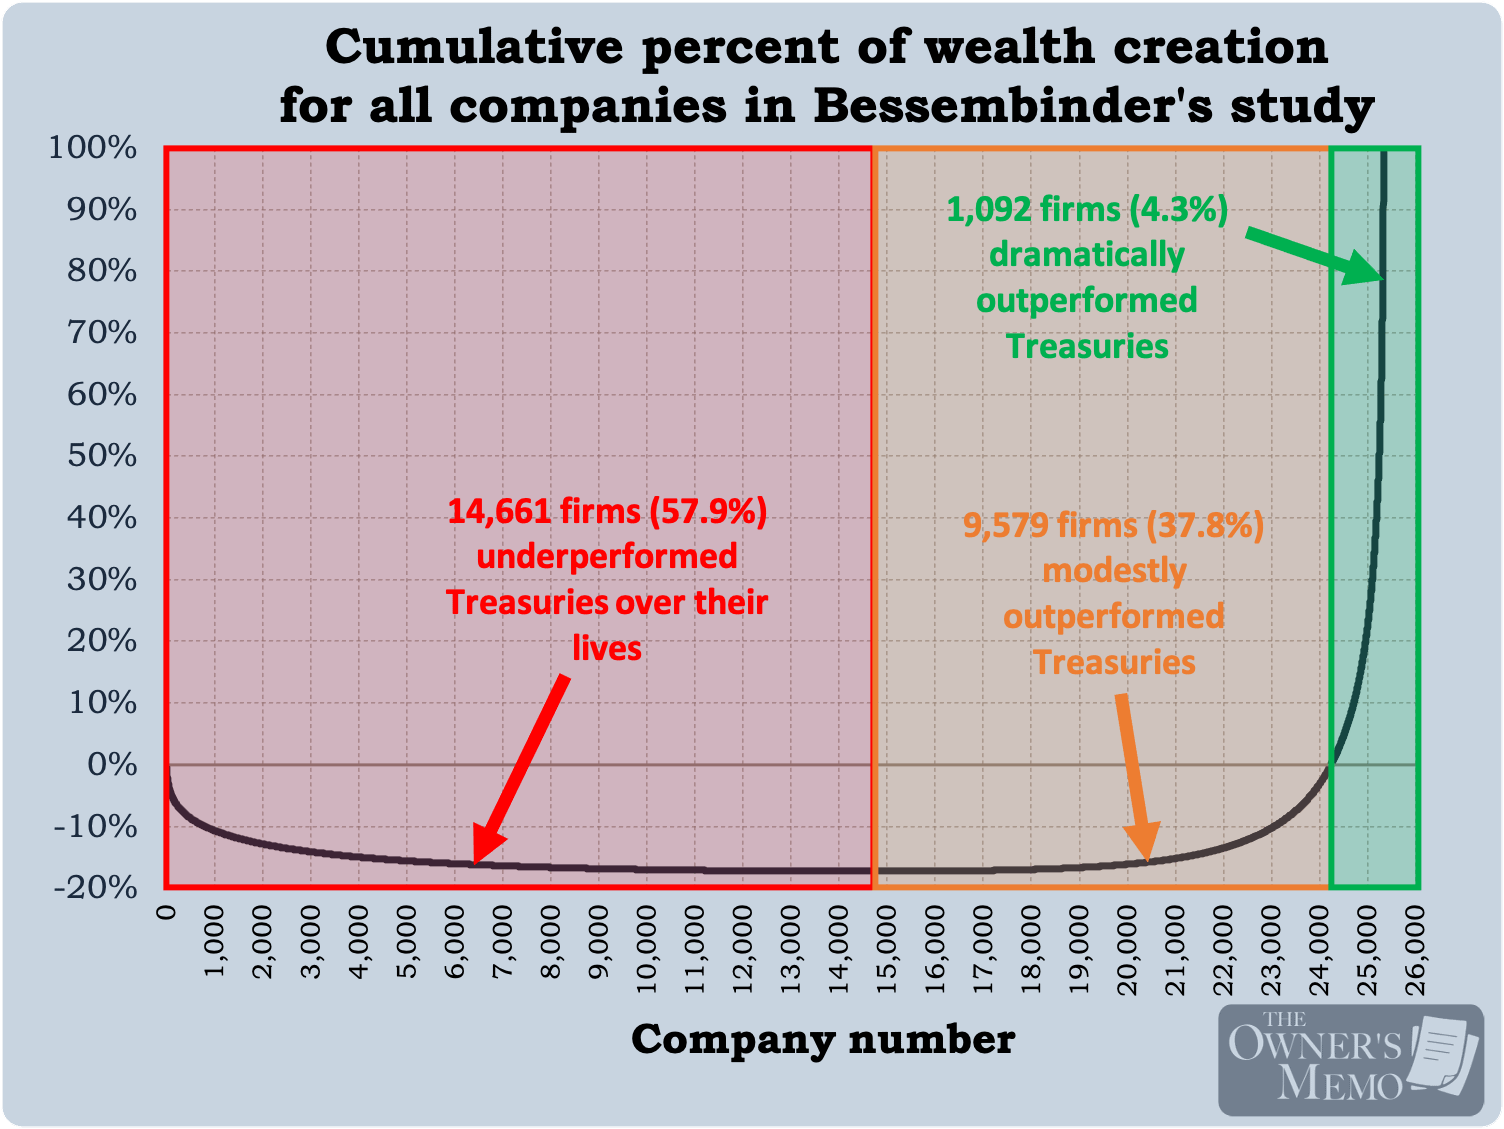
Only 4.3% of stocks produce dramatic outperformance
Most surprising of all, perhaps, is that the vast majority of dollar returns over 90 years was produced by a very small minority of companies. Of the 25,332 companies in the study, only 1,092 of them (4.3%) produced all of the net gains when compared to a competing investment in one-month Treasury bills.2 In other words, we can divide the stocks into three groups:
Those that produced dramatic outperformance vs Treasuries (1,092 stocks or 4.3% of stocks),
those that produced only modest outperformance (9,579 stocks or 37.8% of stocks), and
those that underperformed Treasuries (14,661 stocks or 57.9% of stocks).
Duca’s point in referencing the study is that, if one is going to engage in individual stock investing, he had better do everything he can to be invested in that small minority of companies and stocks that lead to dramatic returns (those in bucket number one). Otherwise, he is at risk of producing only modest outperformance for all the work he will be doing, or worse, selecting stocks in bucket number three.
Most stocks do not even outperform Treasuries in their lives
Bucket number three highlights a second surprising takeaway from the study: the majority of companies did not even outperform Treasuries over their lifetimes. That result flies in the face of one typical understanding of equity returns: that equity investors will outperform Treasuries by virtue of “taking on risk”.
While it is true that a well-diversified equity investor would outperform Treasuries over the 90-year period of the study, Bessembinder shows that an investor who seeks to select single stocks will underperform even Treasuries with the majority of his stock selections. Even worse than that, more than half of the stocks in the study produce lifetime returns that are outright negative.
It is only a minority of companies and stocks that vastly outperform, and one can think of those stocks as being the source of all the outperformance that equities generate over Treasuries. This phenomenon of massive outperformance from a small minority of companies is known as skewness of returns and it is well-known among equity investing researchers.
The purported benefits of diversification
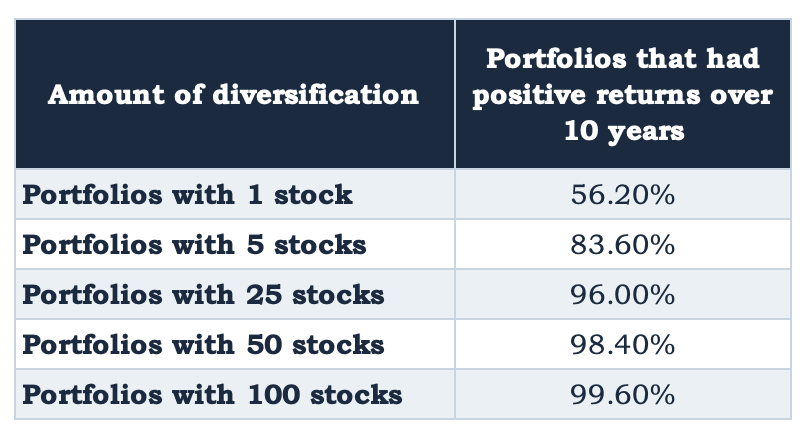
Skewness is often pointed to as a reason for equity investors to be diversified. The logic is as follows. If so many stocks underperform even Treasuries, and so few dramatically outperform, then shouldn’t one ought to select a wide variety of stocks in order to minimize the chances of being in the bad bucket number three and maximize the chances of selecting one of the big winners?
Bessembinder advocates “yes” and highlights this benefit to diversification in his paper by constructing random portfolios consisting of various numbers of stocks (shown below) which turn over their holdings every month. The results show the protection from diversifying to more and more stocks: diversified portfolios are better able to avoid poor results.
The drawbacks of diversification
So why does Duca seem to take the opposite view, stressing the importance of concentration in his interview?
Well, the typical plea to seek diversification is sound advice for index investors who want to achieve market-like returns, but I believe (and so does Duca) that it is unsound for any active stock-picking investor who seeks to dramatically outperform.3
Bessembinder’s mock portfolios are selected randomly and mechanically and do not reveal the biggest danger that diversification introduces: the fact that no portfolio manager can know 25 positions as well as he knows five positions. As a result, when the price of one of those 25 selections begins to fall, he will be more likely to take the opinion of Mr. Market and jettison the position, rather than exploit Mr. Market’s mania and hold on or purchase more.
This is why many great investors stress concentration with only a small amount of diversification. Selecting a small enough number of stocks, like three to five or possible a few more, seems to strike the right balance between protecting oneself against ruin on one side and against not really knowing what you own on the other. As Buffett and Munger were fond of saying, “three wonderful businesses is more than you need in this life to do very well.”
…Within Berkshire, I could pick out three of our businesses. And I would be very happy if they were the only businesses we owned… three wonderful businesses is more than you need in this life to do very well.
I mean, if you look at how the fortunes were built in this country, they weren’t built out of a portfolio of fifty companies. They were built by someone who identified with a wonderful business… there aren’t fifty Coca-Colas [an example of a great business].
- Warren Buffett, Berkshire Hathaway 1996 annual meeting
That is why Duca stresses concentration.
Investment managers are incentivized to diversify
Moreover, the academic logic about the benefits of diversification persists in part because the investment management industry is incentivized to follow it. If an institutional manager is paid a percentage of assets under management, like many are, that payment incentivizes diversification so he or she may decrease the risk of ruin, stay in the game, and earn the fees as long as possible, all at the expense of any significant outperformance for their clients.
So, Bessembinder’s study reveals the first reason that most active portfolio managers underperform their index: most individual stocks underperform too. But it doesn’t say anything about the second reason: if one diversifies too much, one will not know any of his positions very well, and, as a result, he may fall prey to following Mr. Market.4
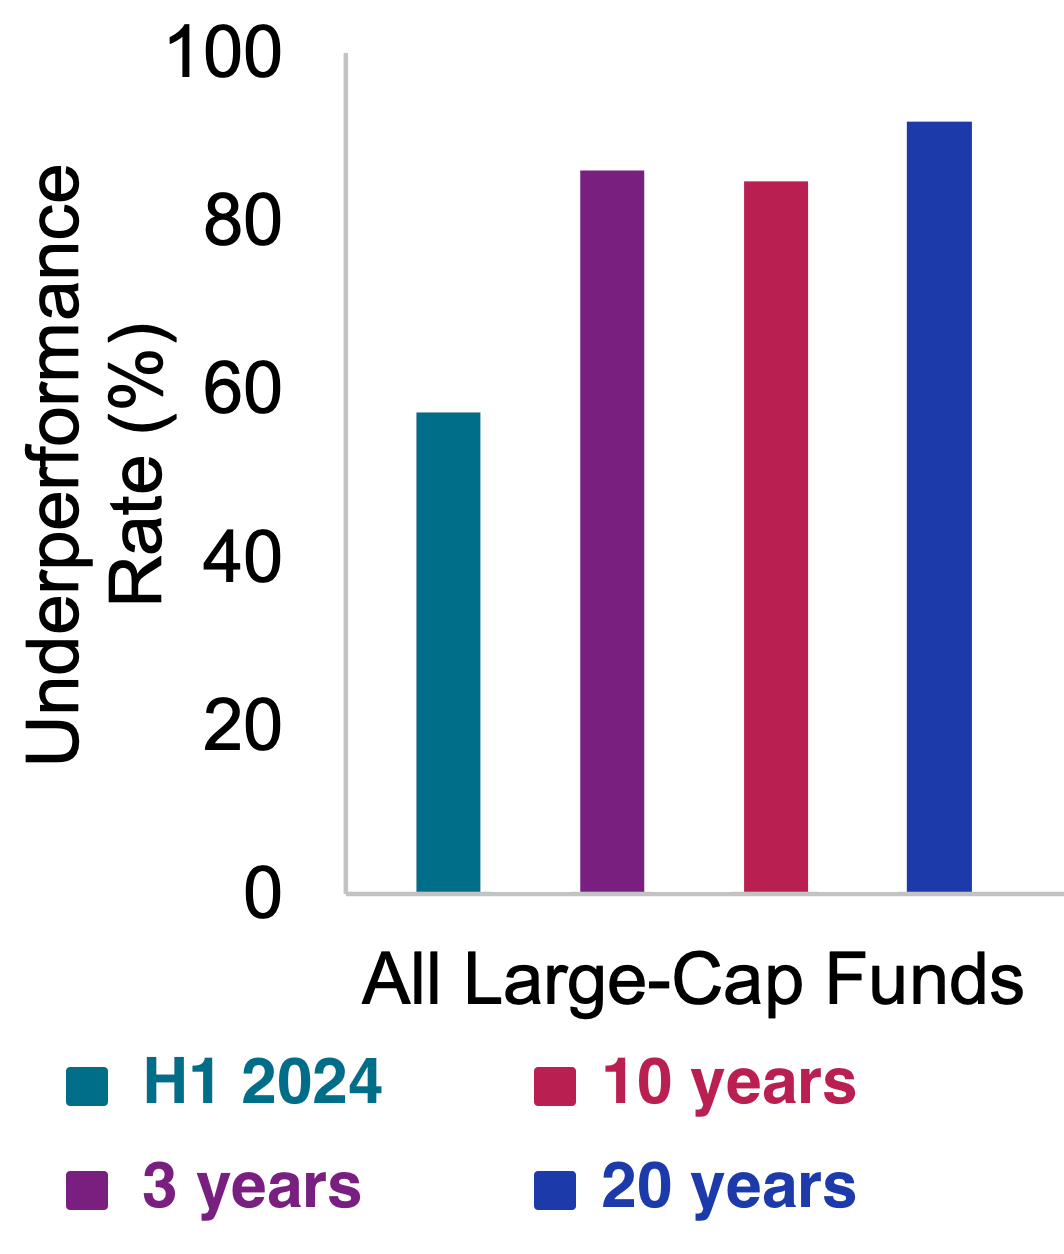
The chart below is from S&P Global’s SPIVA research and shows the degree of underperformance by US large-cap equity funds after fees. Over the past three years, for example, over 80% of fund managers underperformed their benchmark.
Instead of seeking diversification, and as difficult as it may be, the active stock-picker looking to dramatically outperform would be better served concentrating his effort on turning over as many rocks as he can and acting much more deliberately, only when he finds one of the few, rare, great companies (or opportunities) and investing heavily in it.
The greatest companies
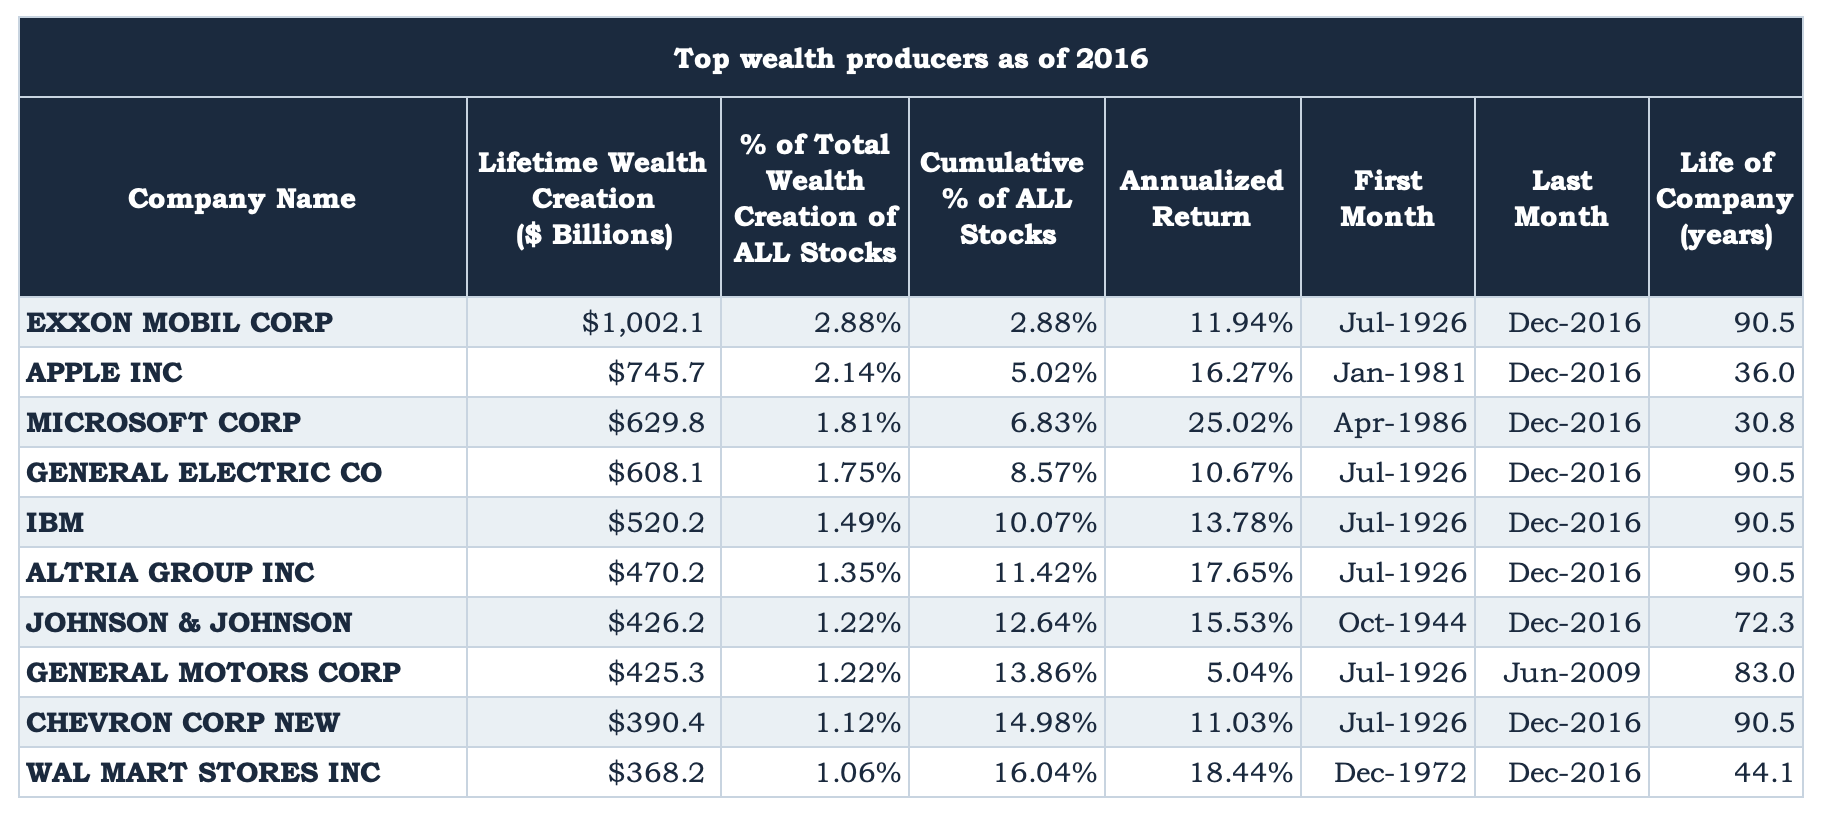
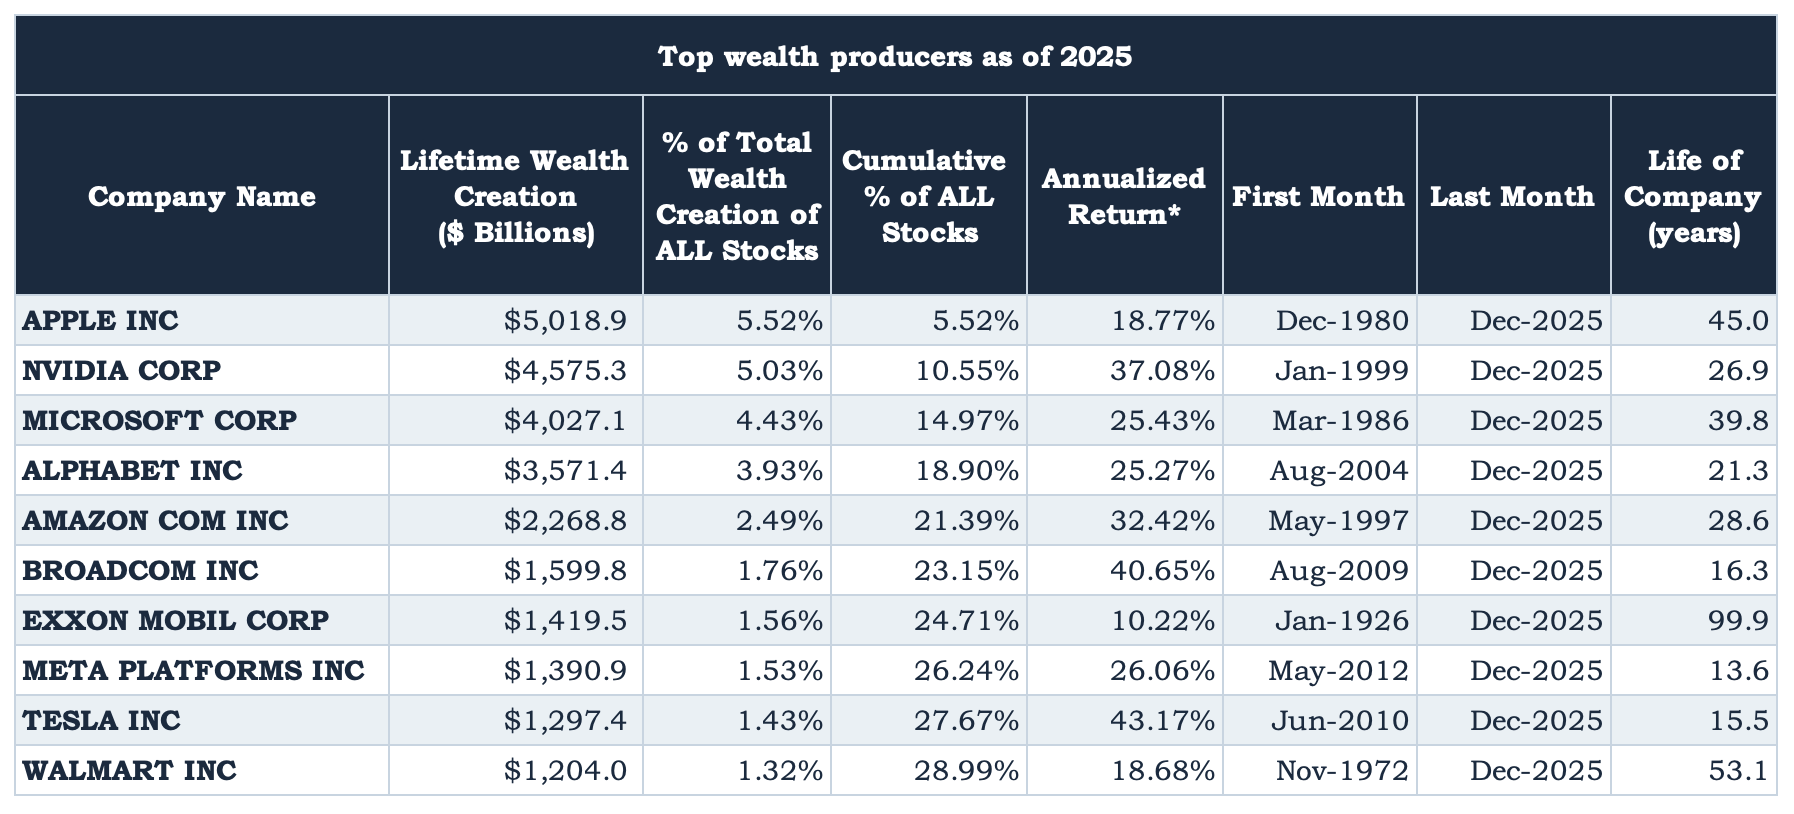
In his report, Bessembinder publishes a list of the top 50 companies that have produced the largest dollar returns over the 90 years of the study through 2016. I show the top ten below. The company at the top of the list, Exxon Mobil, generated $1.0 trillion of wealth, meaning that a hypothetical investment equal to the company’s market cap in 1926 would have generated $1.0 trillion more than the equivalent investment in one-month Treasuries through 2016.
As you can see in the last columns of the table, six of the top ten companies on the list have generated their wealth over the entire 90 year duration of the study. (The remaining four needed less time than that to generate such wealth). Generally speaking, more time in existence means more dollar profits accumulated by the firms.
Before I discuss some of the results shown above, there is an important point to make. Bessembinder’s study is so popular that he has published four subsequent updates to the 2016 data at the ASU website, with the latest version from 2025.
Because of the tremendous run that technology stocks have had over the past nine years (and longer), the table above has changed dramatically. See the 2025 version below.
There are a few points to make here.
1. Staggering value produced
First, the amount of dollar wealth created by the largest firms in just the past nine years alone dwarfs that produced by previous US stalwarts. The wealth figures in Figure 5 are measured in trillions of dollars, while those in Figure 4 are hundreds of billions. Naturally, the past nine years have been fantastic for holders of large tech stocks.
2. Compounded returns
The companies on the 2016 list produced large dollar amounts of wealth, but the level of annualized returns they produced is what I would call very good but not extraordinary. (Microsoft is an exception, with a 25.02% annualized return.) This is especially true for those companies that produced their dollar returns over the full 90-year duration of the study. Simply put, it is very, very hard to maintain extraordinary rates of return for very long times. Take the top company on the list for example, Exxon Mobil. Over the course of 90 years, the company produced just over $1 trillion of wealth and an annualized return of 11.94%. That compares to a return for the S&P 500 of 9.9% per year. The dollar amount of wealth produced by Exxon Mobil is astounding, but the level of annualized returns is not near the astounding levels we typically associate with great investors or great investments.
However, the companies on the 2025 list in Figure 5 produced not just huge dollar amounts of wealth, but also did so while producing extraordinary annualized returns (Exxon Mobil being the exception). This may be a function of the fact that technology stocks have been in an extended golden era, or it may be because the economics of many of these firms are quite different than the businesses in the 2016 list. They are generally less capital-intensive and some of them have near-zero marginal production costs, making them very valuable. Alphabet is a good example of that, and it has produced $3.5 trillion of wealth and a stunning 25.27% annualized return over its 21 years of life through 2025.
3. Return inconsistency
For most of these great companies on either of Bessembinder’s lists, they likely did not produce consistent returns for their entire duration. Exxon Mobil produced 11.94% per year over 90 years, but for the past 20 years, from July 2005 to July 2025, the stock only returned 6.7% per year (compared to 10.5% for the S&P 500). And for the 20 years prior to that, from July 1985 to July 2005, the stock returned 15.2% (compared to 12.3% for the S&P 500).
Even Nvidia, the stock story of the decade, which produced $4.5 trillion of wealth and a mind-boggling 37.08% annualized return over its 26 years through 2025, wallowed in underperformance for much of its life. For the 10 years between December 31, 2001 and the same date in 2011, the stock produced a negative annualized return of -4.83%.
Such inconsistency in outperformance should serve as a caution to investors that “great companies” may not be great investments for the entirety of their lives.
In a coming article, I will dive more into great companies with great investment returns using another Bessembinder study. Instead of focusing on dollar-based returns, we’ll discuss the level of annualized returns that are typical of great investments. The goal will be to develop a sense for what levels of returns might constitute astounding performance and just how difficult that might be to achieve over a certain period of time.
Summary
There are three big takeaways from Bessembinder’s fantastic work.
Only a small minority of (great) companies produced all of the net gains versus Treasuries over the long term.
The majority of companies did not even outperform Treasuries over their lifetimes.
Diversification is critical if you want to realize market returns, but it is deadly if you want to produce massive outperformance.
For any individual investor seeking to produce stunning returns, Bessembinder’s study should serve as a reminder of that it is rare to find great companies and great investments. I must be prepared to search through and study many duds before finding one worthy of the punch card.
The study defines wealth creation as the accumulation of market value from the starting period to the ending period in excess of the value that would have been obtained from investing an equal amount in one-month Treasuries.
In the interview, Duca reports the results slightly incorrectly:
And of the 26,000 companies, 25 of the 26,000 companies produced returns that are T-bill returns or less. So in other words, there was only 1,000 companies that could create excess returns above risk-free T-bills returns.
Duca’s interpretation, that only 1,000-odd stocks outperformed Treasuries is incorrect. Rather, 10,671 stocks out of 25,332 outperformed Treasuries. The number Duca is referring to is the highest-performing 1,092 stocks in the study that make up all of the net dollar gains in value over 90 years versus Treasuries. (All of the remaining stocks, 24,240 of them, merely had a net dollar return of zero versus Treasuries, that is, some of those stocks made money versus Treasuries and some lost money.)
Contrary to what I wrote, there may be a few edge cases where a diversified, active portfolio can indeed produce outsized returns, like those from practitioners of quantitative investing who are deliberately trying to exploit certain market inefficiencies, but those edge cases are not what I’m talking about here.
There are a host of reasons why most active managers underperform (before fees are even taken into account). Reason number one, as mentioned and as Bessembinder shows, is because most stocks underperform. Reason number two, I believe, can be bucketed into “poor investment psychology”, like listening to Mr. Market when one should be forming one’s own judgment or making investment decisions on the basis of what might look good to one’s clients rather than one’s own judgment. Reason number three is simply the drag created by management and performance fees.
Note: Bessembinder’s work has been very popular, and he has given a number of informative interviews about it. Check out this one with Meb Faber to hear the man himself discuss his work.