


Mohnish Pabrai is a great investor, well-known in value investing circles, not just for his investing prowess but also, and in my opinion more importantly, for the way he shares his knowledge freely with the world.
Pabrai can regularly be seen on his Youtube channel giving interviews or talks to student groups who can ask him any questions they want. He answers freely, often recounting past investment successes and equally telling self-effacing stories of his own misses and boneheaded plays. His style is refreshing.
One of the successes that Pabrai discusses in a few interviews is his investment in Frontline Ltd., a company engaged primarily in the shipping of crude oil, as well as other commodities. There are two great sources for Pabrai’s recounting of his Frontline investment, and one is his interview with Shaan Puri, linked below.

Pabrai also wrote the fantastic book, The Dhandho Investor, and in it, he describes the Frontline story over seven pages. He discusses how he first encountered the shipping business by scanning the pages of The Value Line Investment Survey in 2001 and finding an oil shipping company called Knightsbridge that was trading at a dividend yield of 15%.1 He studied Knightsbridge and the oil shipping industry to discover why the dividend yield was so high.
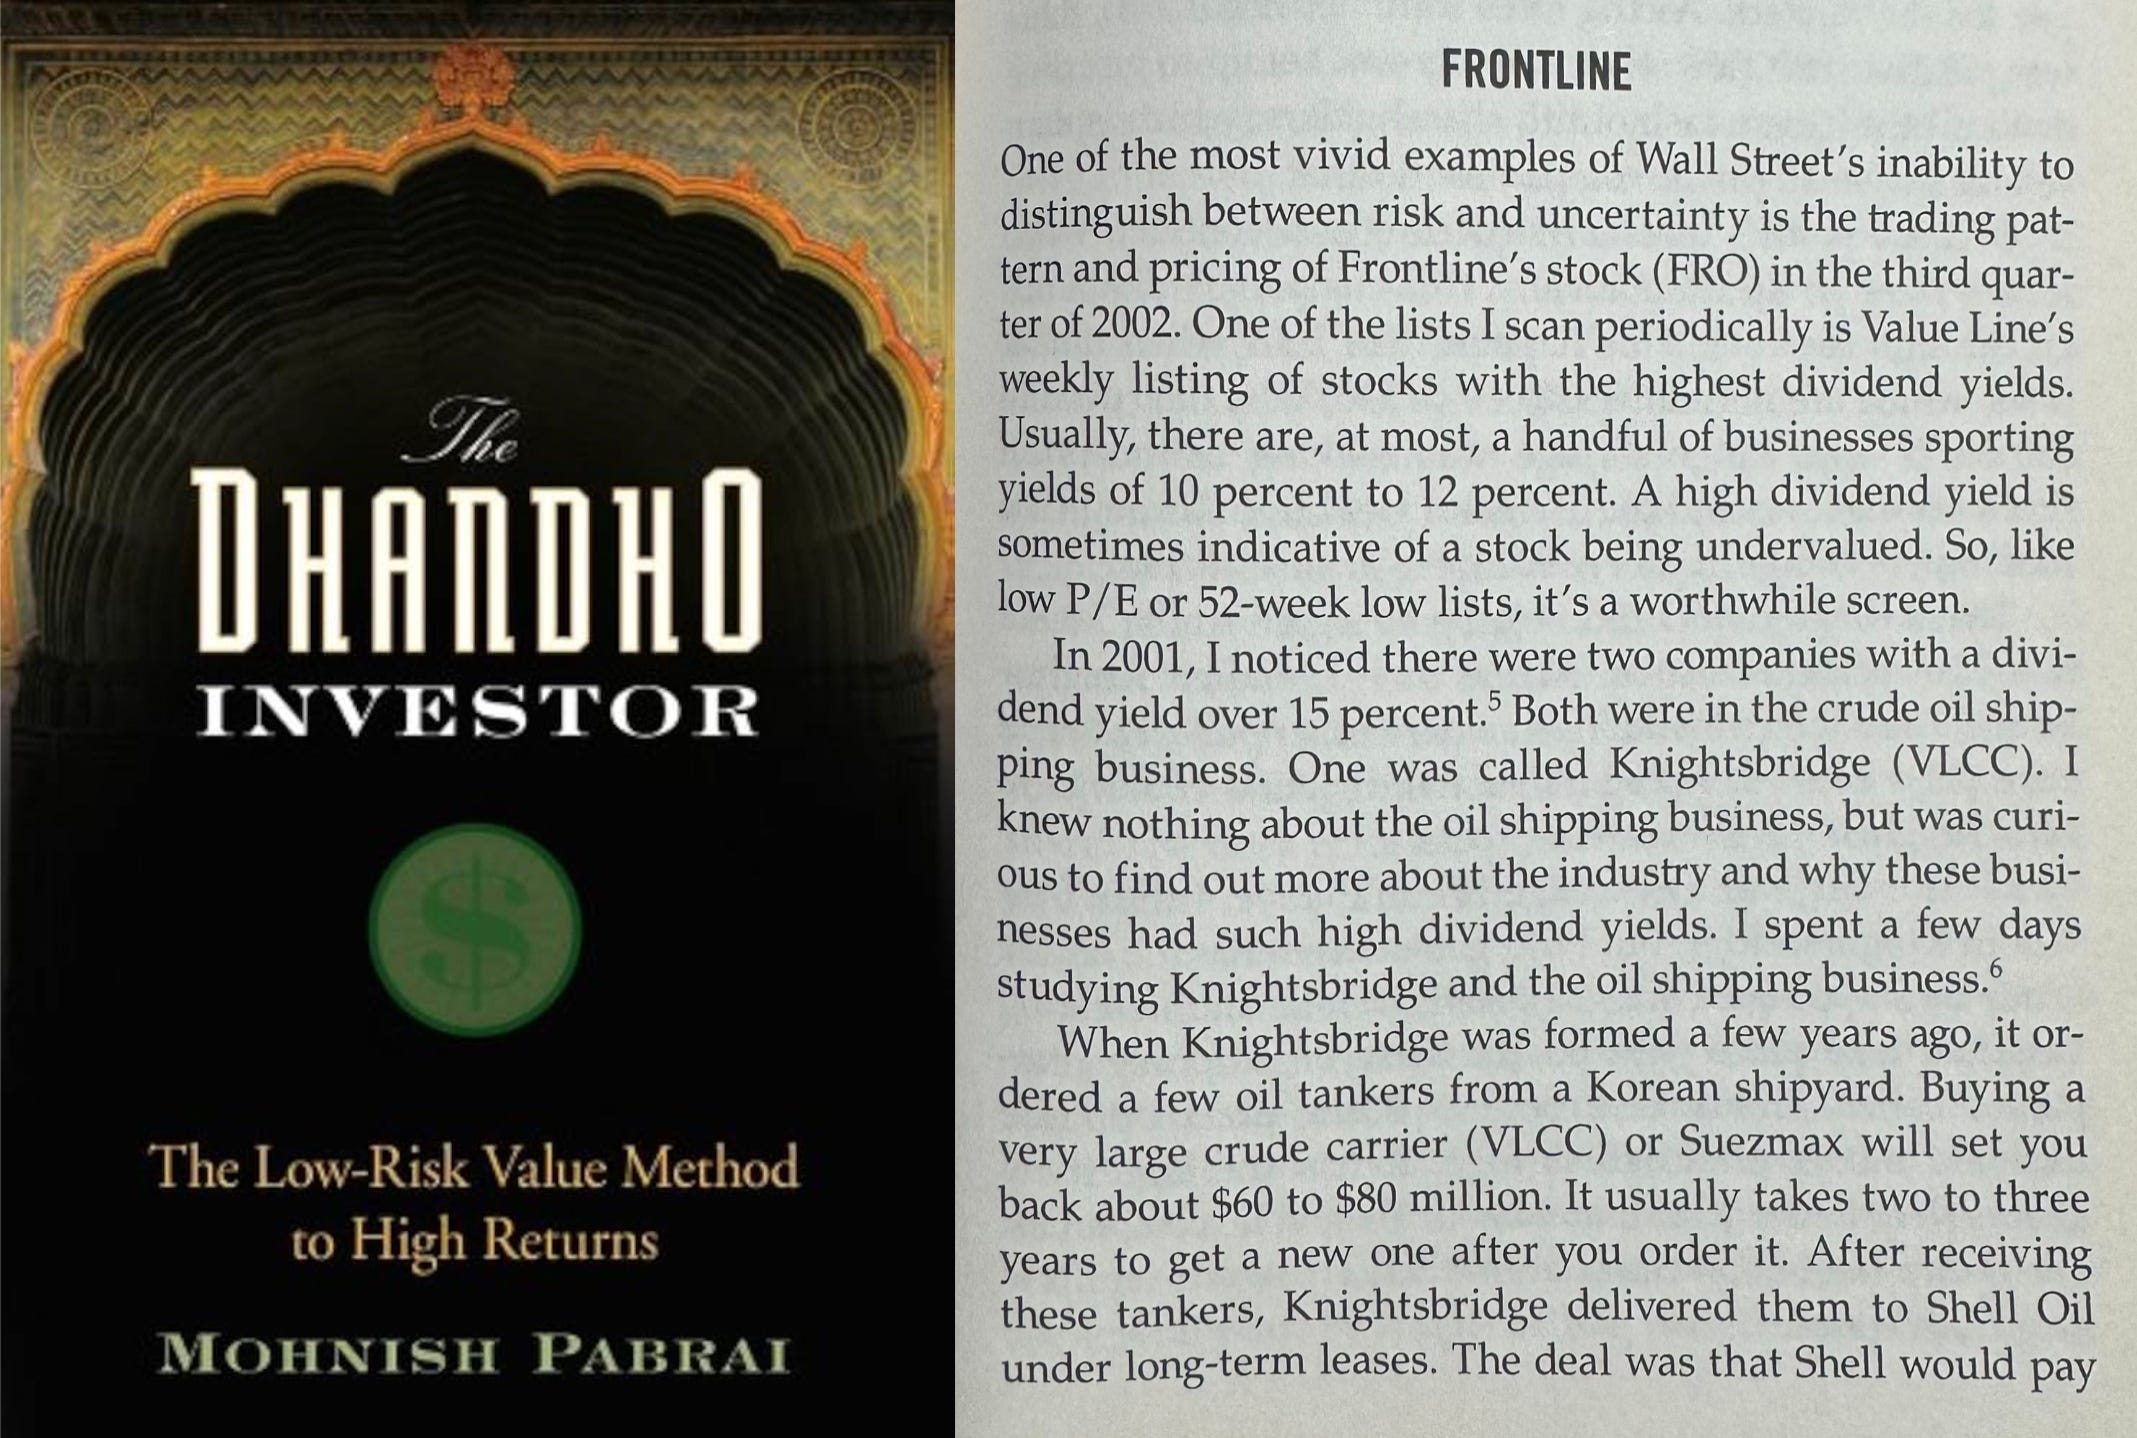
Pabrai describes a market whereby ship lease rates (called charter rates) were historically high and which was very profitable for shipping companies, and he was skeptical that the good times could be sustained. The high charter rates, as I learned, occurred toward the end of the year 2000, a year in which Knightsbridge earned $48.7 million in income, or $2.85 per share. The company was set up to distribute its profits to shareholders in the form of dividends, and it distributed nearly all of its income that year. In the third and fourth quarters of 2001, the company’s stock traded between $22.69 and $14.32, which explains the high dividend yield that Pabrai saw.
Because Pabrai thought the recent results were bound to abate, he ultimately passed up an investment in Knightsbridge in 2001. However, as he reflects in his book and as Buffett is fond of saying about investing,
Everything you learn is cumulative… What I learned at twenty is useful to me now. What I learned at twenty-five is useful to me now… It’s not a field that changes dramatically in terms of the underlying principles.
- Warren Buffett, interview with Forbes (April 2014)
Being patient and finding opportunity later
Sometime in the late summer or fall of 2002, Pabrai rediscovered the shipping industry when charter rates declined to very low levels and the industry was suffering.2 He reports in The Dhandho Investor,
The stock price had gone from $15 to $3 in short order.
Pabrai is talking about the rapid decline in Frontline’s stock price from a peak daily close for the year of $12.94 on May 20, 2002 to a low of $3.43 on September 24. Frontline’s stock had fallen 73% in just four months. Based on comments Pabrai made in his interview, I believe he started revisiting the shipping industry and looking at Frontline around the end of August or beginning of September when the stock was around $6 per share. We’ll use September 15, 2002 as the cut-off for any information Pabrai would have had available.
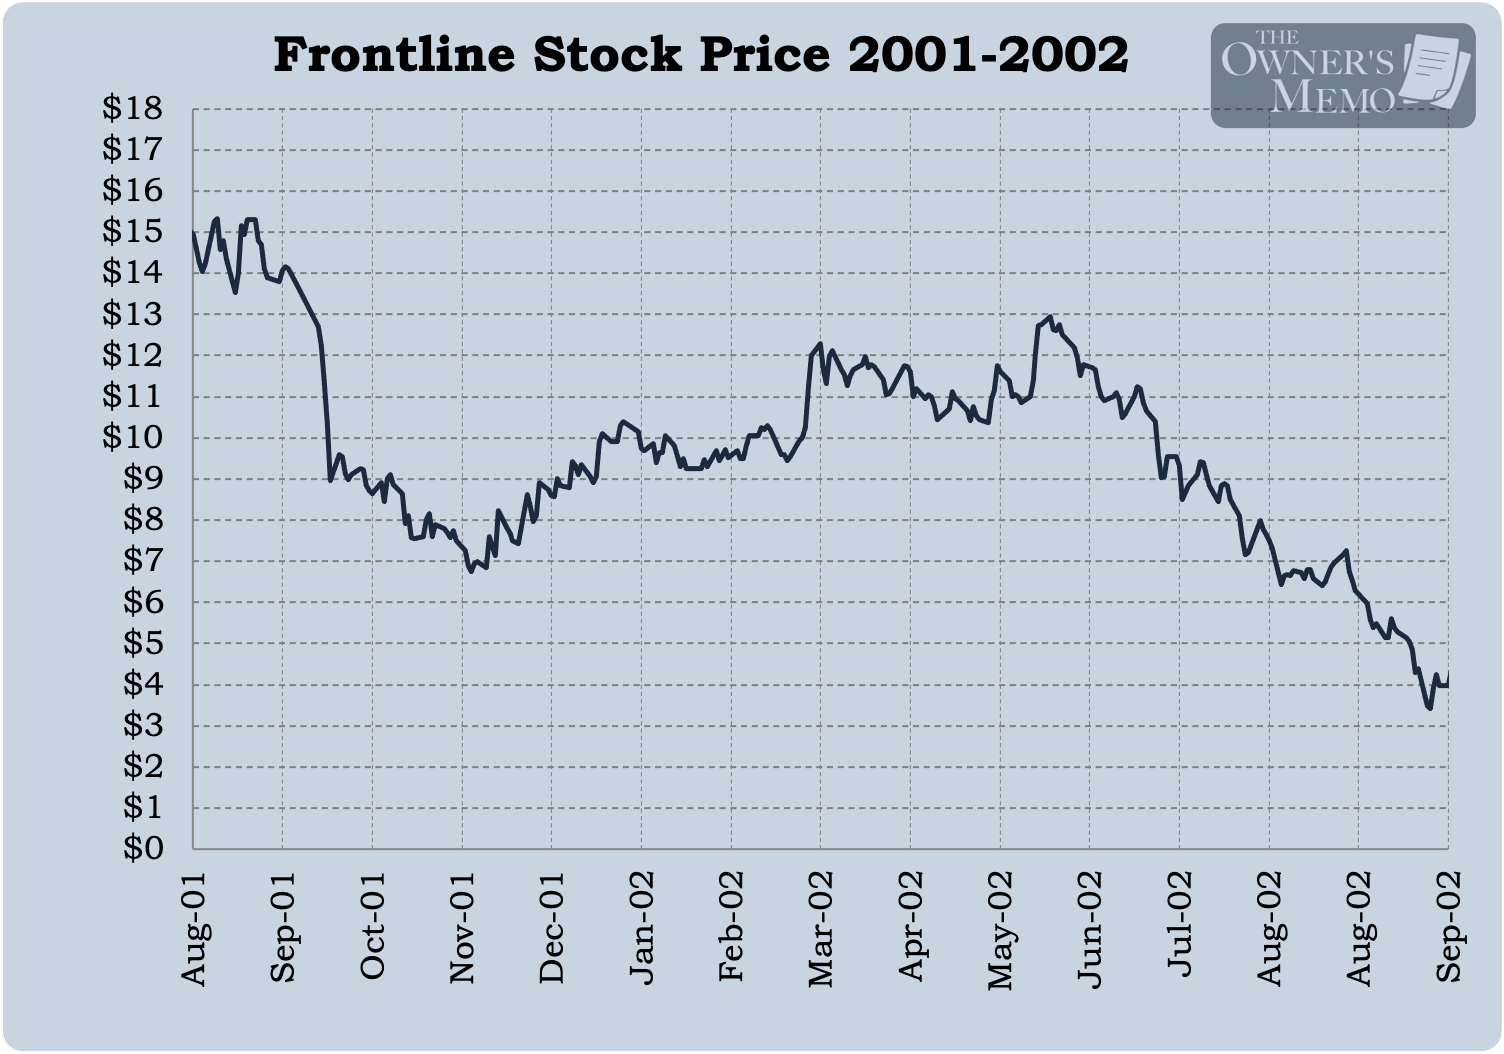
As of that date, Pabrai would have had access to the 2001 annual filing form 20-F (filed on July 12, 2002) and the semi-annual 6-K (filed August 22, 2002), in addition to any material prior to that date.
A quick glance at those two documents shows that Frontline made $382 million in 2001, and it lost -$16.9 million in the six months from January to June 2002. In fact, those glaring differences reinforce how volatile Frontline’s business was, something Pabrai already knew from studying the sector back in 2001.
At a stock price of, for example, $6 per share, with 76,466,566 shares outstanding, Frontline would have had a market capitalization of $458.8 million, just 1.2 times the total amount of profit the company made in 2001. It may have been this simple comparison alone that led Pabrai to dig in deeper to see if this was an overreaction by Mr. Market or if there were more serious problems with Frontline.
Let’s take a look ourselves.
Frontline and the global shipping industry
Frontline is a shipping company whose business is the ownership, operation, and chartering out of ships, the majority of which were oil tankers. Oil shipping companies make money by building or purchasing oil tankers and then chartering them out to other companies that need to move oil from one location on the globe (like the Middle East) to another (like the US or China). These other companies can be major oil companies, like Shell or BP, national governments, and commodity trading firms.
The shipping industry is filled with jargon, so let’s review some of it so we can examine the opportunity in Frontline intelligently enough.
Crude oil carriers are generally delineated by their size and/or the amount of cargo they can carry. Their capacities are expressed in “deadweight tonnage” (dwt), which is the amount of stuff a ship can carry, including cargo, fuel, fresh water, stores, and crew.
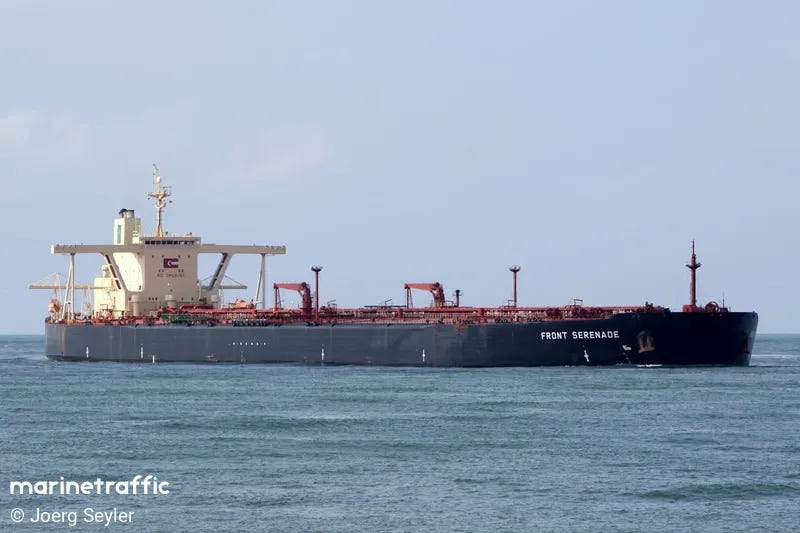
Crude oil carriers are typically categorized into six segments:
VLCC (very large crude carrier) - tankers over 200,000 dwt and up to 320,000 dwt; generally carry about 2 million barrels of oil. Used for long hauls.
Suezmax - 120,000–200,000 dwt; carry roughly 1 million barrels of oil; these tankers are able to transit Suez Canal fully loaded, hence their name. Generally medium hauls.
Aframax - 80,000–120,000 dwt; typically carrying around 0.5 million barrels of oil
Panamax - 60,000–80,000 dwt; Generally very short hauls.
Handy (or “Products”) - 10,000–60,000 dwt
Small tankers - less than 10,000 dwt
Since 1996, we have emerged as a leading tanker company within the VLCC and Suezmax size sectors of the market.
- Frontline 2001 20-F annual report
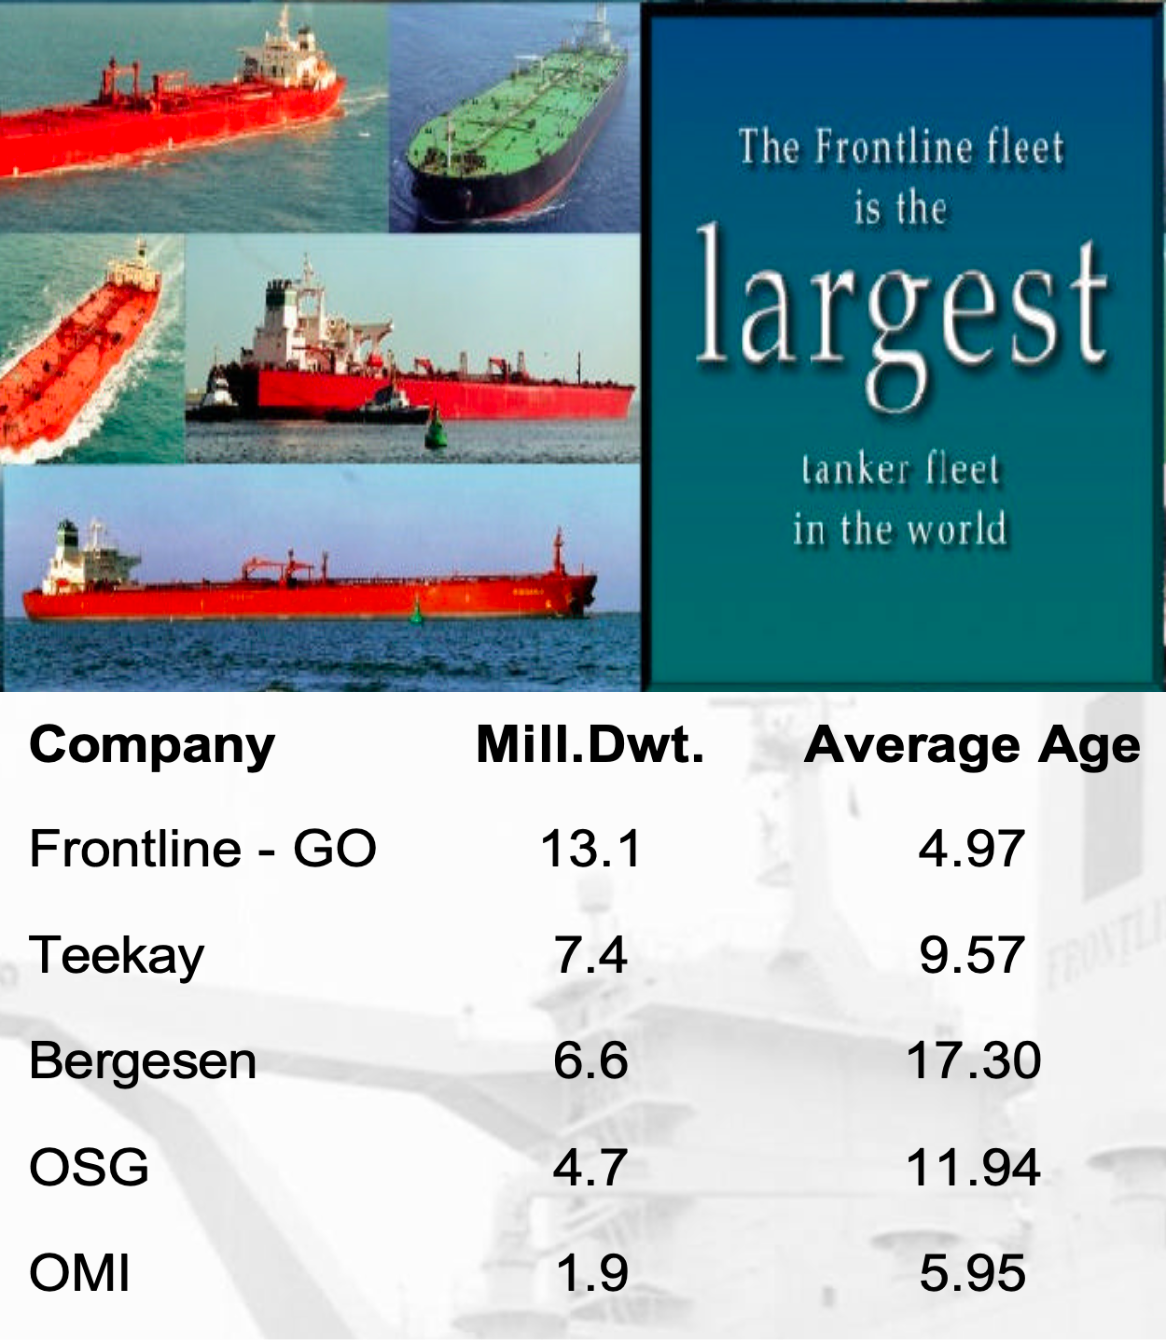
In 2002, Frontline owned one of the largest fleet of crude oil carriers in the world, if not the largest. It owned a total capacity of 14.0 million dwt, much more than its closest competitors. Its owned fleet consisted of 29 VLCC’s, 30 Suezmaxes, and 10 other ships that were engaged in the business of shipping dry commodities. A report from Clarksons in September 2002 lists the world VLCC fleet at 428 ships and the world Suezmax fleet at 270 ships. Frontline was a big player in a fragmented industry.
Shipping companies typically put their ships out for charter in one of three ways:
Bareboat charter. The owner provides only the ship, and the charterer operates the ship fully. Rates are long-term, often five to twenty years, which can help insulate the owner from the vagaries of charter market rates but also deny it any upside.
Time charter. The owner provides the ship and the crew. The charterer directs trade and pays for fuel. Rates are medium-term, often months to a few years.
Voyage (or spot) charter. The owner bears all shipping costs. Rates reset every trip and expose the owner to the full risks and benefits of the charter market. Most of Frontline’s ships were on the spot charter market.
The oil shipping business is fundamentally a very difficult business. In general, there are many competitors, and it is difficult to differentiate your product (which is moving oil from one location to another) from that of others. So, the companies that operate in the space are all supplying roughly the same commodity. Worse, the price of that commodity, which is the market rate for chartering a ship, can be volatile and difficult to predict.
Shipping cycles
This has been a deeply cyclical business for the past 100 years and there is little evidence that it is about to change.
- Teekay Shipping Corporation 2001 annual report
I read many great sources as I was building this case study, from annual reports to a textbook to even a great fiction work called The Shipping Man by Matthew McCleery. In every piece, it was readily apparent that the shipping industry is deeply cyclical.
Why is shipping cyclical? Because charter rates depend on two factors, the demand for shipping (crude oil in the case of Frontline) and the supply of ships for hire. From the Frontline 2001 20-F annual report:
The factors affecting the supply and demand for oil tankers are outside of our control, and the nature, timing and degree of changes in industry conditions are unpredictable. The factors that influence demand for tanker capacity include:
demand for oil and oil products;
global and regional economic conditions;
the distance oil and oil products are to be moved by sea; and
changes in seaborne and other transportation patterns.
The factors that influence the supply of tanker capacity include:
the number of newbuilding deliveries;
the scrapping rate of older vessels;
the number of vessels that are out of service; and
national or international regulations that may effectively cause reductions in the carrying capacity of vessels or early obsolescence of tonnage.
The demand for shipping oil depends primarily on activity in the world economy. When the demand for oil is high, so too is the demand to ship it, and oil shippers can earn healthy profits. However, when oil demand increases, the price of oil also naturally rises in free markets, which both curbs the demand for shipping and makes shipping more expensive through higher fuel costs. When the demand for oil drops, demand for shipping does too, and the profits of oil shippers can decline.
The supply of tankers also influences charter rates. However, while the demand for shipping oil can change over the course of just a few weeks or months, the supply of ships is much more fixed. From the great reference book Maritime Economics by Martin Stopford:3
Merchant ships generally take about a year to build and delivery may take 2–3 years if the shipyards are busy. This prevents the market from responding promptly to any sudden upsurge in demand. Once built, the ships have a physical life of 15–30 years, so responding to a fall in demand is a lengthy business, particularly when there is a large surplus to be removed.
So, what do we have?
When the demand for shipping oil is high, particularly because the economy is doing well, the supply of ships is relatively fixed because they take a while to build, and shipping companies can earn good profits.
Then, many of them take some of those profits and order new ships (called “newbuildings”), so as to capture more business.
Inevitably, something happens to cause the demand for shipping oil to decline, like a recession or the price of oil increasing or exogenous effects like tariffs, causing charter rates to decline. Meanwhile…
The new ships that were ordered start being delivered, causing an oversupply of ships while charter rates are already on the decline. This exacerbates the decline in charter rates, forcing many companies to charter out their ships at too low a rate, leading to losses. Ship owners cease ordering new ships and now need to hunker down and survive.
The most unprepared companies are forced to sell their ships. If a ship is too old to be used, meanwhile, it gets scrapped. This removes ships from the world fleet and helps supply balance out again.
When the demand for shipping oil recovers, so too do charter rates, bolstered by all the scrapping that has occurred over a few years. The cycle upticks and begins anew.
Here is Stopford again:
Shipowners have two jobs. One is to operate ships, a worthy task but not one that brings riches. The other is to be in the right place at the right time, to rake in the money at the peak of a cycle… In the space of a few months a shipowner’s cashflow can swell from a trickle to a flood, and the market value of his fleet can change by millions of dollars. This is how the market manages investment in a difficult and uncertain world, and it presents shipping company management with quite a challenge.
So, charter rates are difficult to predict, highly cyclical, and can be very volatile, dropping by large amounts even over the course of a short period.
What’s worse, many of the expenses that a shipping company must bear are fixed for the long-term, so they cannot be easily managed as charter rates fall. Fixed costs, those that do not change regardless of how much charter business the company does in any period, include crew costs, ship maintenance, insurance, and the company’s capital costs, like interest payments on its vessel mortgage loans and vessel depreciation expenses. Frontline and other shipping companies also bear variable costs, increasing as the company does more business, particularly fuel costs (known as “bunkers” in the shipping industry) for spot chartering.
The simplest way to think of the shipping business, and indeed the way Pabrai describes his investment in his interview and in his book, is that shipping companies carry a bunch of expenses related to owning and maintaining their fleets, expenses they cannot easily control or manage, and the ship charter revenue that the company brings in must exceed these costs in order for the company to make money. But charter revenue is very cyclical and outside the control of the company.
These two parts of the income statement, cyclical revenue from volatile charter rates and the relatively fixed expenses of owning, maintaining, and running ships, are well known in the shipping industry. Maritime Economics shows a succinct representation of the cyclical economics of the shipping business in the figure below on the left.
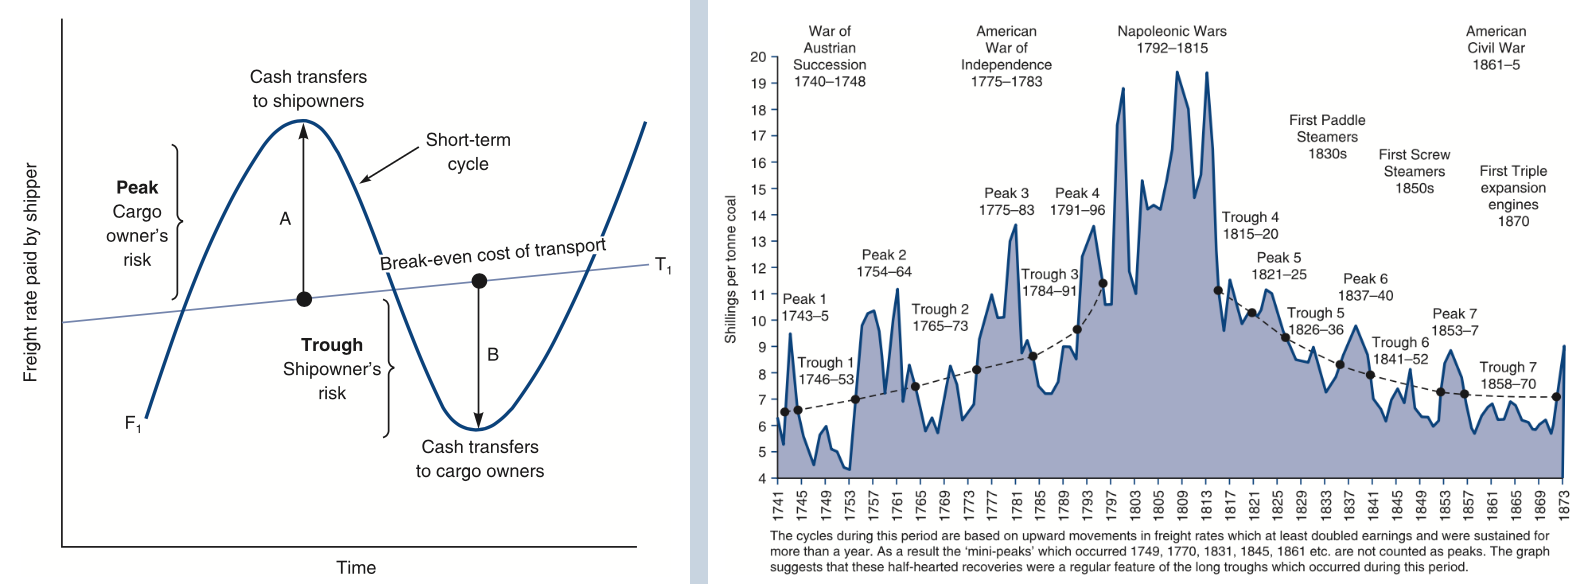
Because this balance between charter rates and a shipping company’s costs are so important, Frontline and other shipping companies typically report both the average charter rates they realized for the period and their expense breakeven number.
Frontline’s realized charter rates shown below for the period 1998 through 2001. I have highlighted the average spot charter rates the company was earning. (Shipping companies refer to the revenue they earn in the spot chartering market as “TCE”, “time charter equivalent”. The term signifies revenue flowing to the company, as distinct from the more generic “charter rate”.)
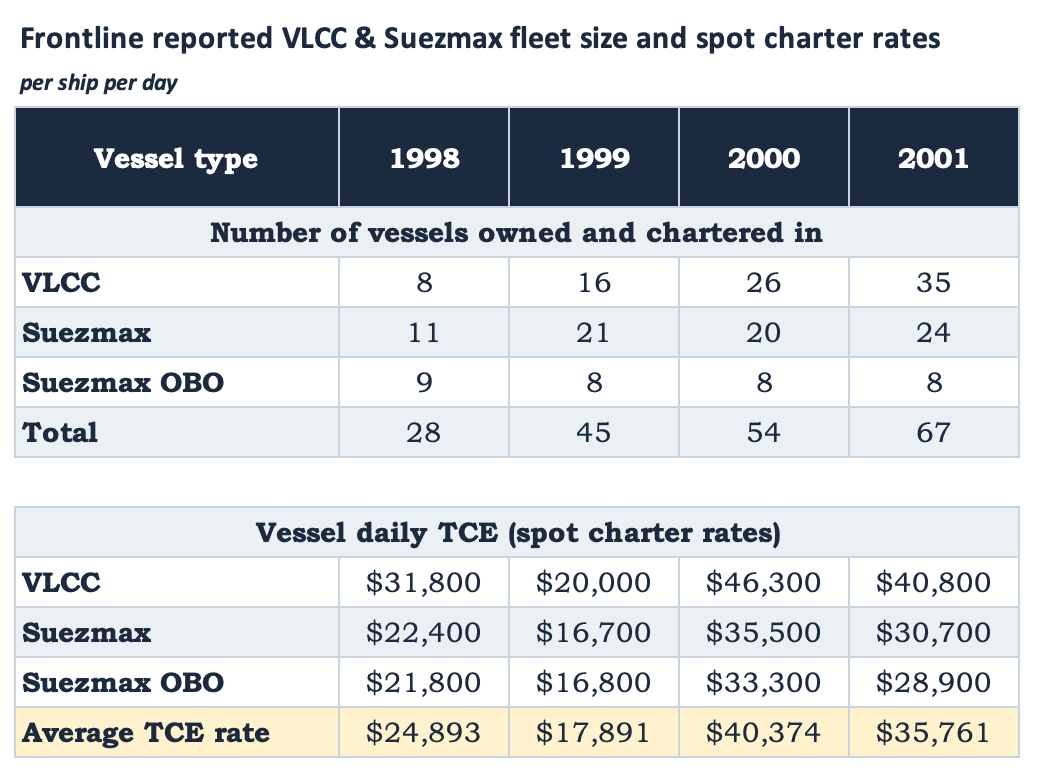
Those TCE rates give a sense for how much revenue Frontline was able to earn each year. The years 2000 and 2001 saw high charter rates, and, as we’ll see, were great years for the company. 1999, on the other hand, was very poor, and 1998 was modest.
What about the cost side of the equation? How much did it cost the company to run its ships, and therefore what level of charter rate was good enough for the company?
Frontline’s reported average operating costs per ship per day are reproduced below.

These rates, however, only tell a portion of the story.
When shipping companies report operating costs, like above, they include only the cost of “running the ship” which is roughly fixed per day regardless of whether the ship is on voyage or idle. They exclude some other costs, primarily bunker costs (fuel) and the company’s capital costs.
However, by searching other company filings, I was able to find just a few mentions of the figure we are after: the all-in breakeven cost of running the company per ship per day. This figure is not reported as regularly as the operating cost figure, but the company’s 6-K report from March 2002 had a good (and, for Pabrai) timely disclosure:
Profit and loss breakeven for our VLCCs is currently about $21,100 per day and for the Suezmaxes is $13,400 per day.
These two figures include all the costs Frontline had to bear, so they tell us the TCE rates that Frontline must earn to be profitable as a company. I calculate the weighted average figure to be $17,400 based on the number of each vessel type Frontline owned.4

Now that we have an idea for the charter rates the company needed to earn to generate a profit, can we get a sense for how likely the company was to see a profitable charter market? How does this breakeven TCE rate compare to TCE rates historically? Those are shown in the chart below, using data from Clarksons Shipping Intelligence Network.
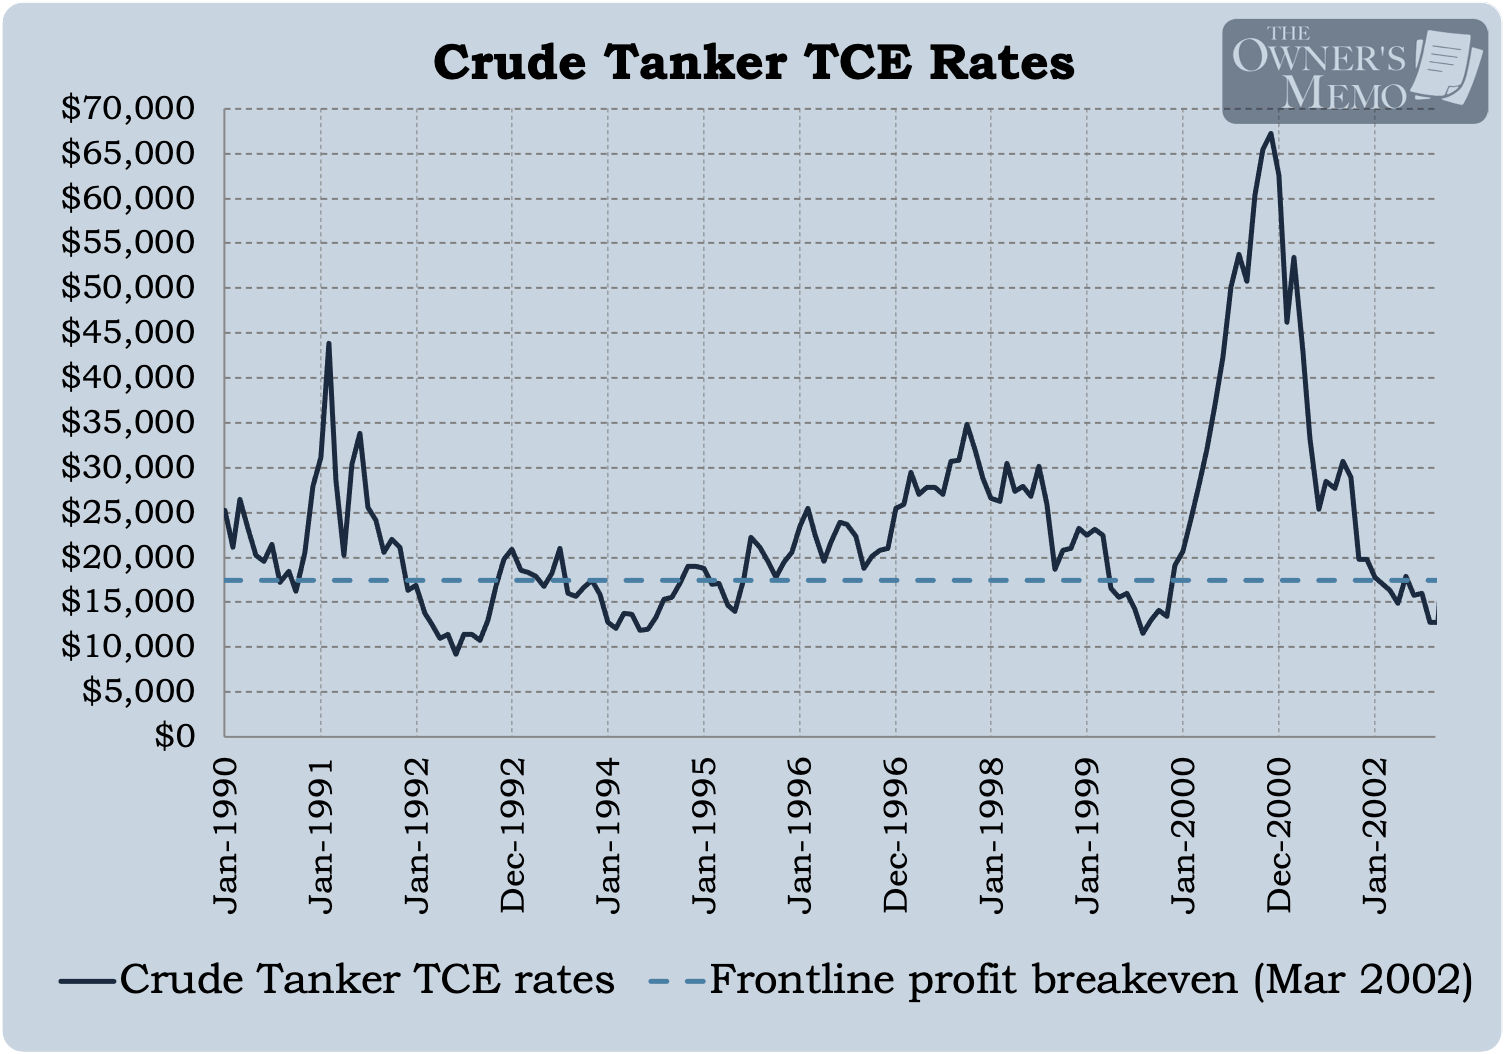
So, after a bit of analysis, tanker TCE rates had dipped below Frontline’s breakeven rate for most of 2002. As of September 2002, industry TCE rates reported by Clarksons were around $12,700 per ship per day, almost $5,000 less than Frontline’s breakeven rate. If these rates persisted, and with 67 tankers in its fleet,5 Frontline stood poised to lose on the order of $120 million a year.
This is the situation Pabrai encountered in September of 2002, when he rediscovered Frontline and the shipping industry. Frontline was one of the largest shipping companies in a highly cyclical industry whose stock price had taken a deep dive during another of the industry’s downturns.
Given everything I just described, like the highly cyclical and unpredictable nature of the shipping industry, why would anyone except the most risk-seeking gamblers in the world want to be involved in an investment? The answer, of course, is the potential price of that investment.
I don’t know exactly how Pabrai rediscovered Frontline in 2002, but I suspect he saw just how low its stock price dropped and thought “maybe that’s too low”.
But how could he assess how low a price was too low? After all, given the fixed breakeven cost of the company, if TCE rates never rose above $17,000 to $18,000, then Frontline would be a company that never made any money at all.
In Part Two, we’ll delve deeper into some other risks around Frontline and then discuss Pabrai’s rationale for making an investment.
References:
Stopford, Martin. (1997). Maritime Economics (2nd edition). Routledge.
Stopford, Martin. (2009). Maritime Economics (3rd edition). Taylor & Francis.
McCleery, Matt. (2012). The Shipping Man. Marine Money International.
I searched back issues of Value Line from that time period, but I could not find an entry with shipping companies trading at high dividend yields. Strangely, I could not even find an entry for the company Knightsbridge, not Frontline, back in 2001.
Pabrai doesn’t say exactly how he came across the shipping industry again. He could have discovered the low prices in the sector through reading Value Line manuals or others like Mergent manuals, which might have showed low P/E ratios for some shipping stocks, or he could have kept a regular watchlist of stocks that alerted him to Frontline or another shipping company’s stock falling below a price level he had previously flagged.
In many industries, there are reference bibles, so to speak, and Stopford’s massive work is one of those. In fact, I found it to be so well-written that I think it rises above even that designation. I have experience in both finance and science, and I struggle to name another reference work that both as comprehensive and readable as Stopford’s book. If you are curious about the shipping industry, his book is a no-brainer.
We can also sanity check these figures for ourself by estimating them from the company’s income statements from prior years. If we know (1) how much net income the company made and (2) how many ships the company owned, we can estimate the net income earned per ship. And if we compare that to (3) the average TCE rates the company earned that year, the difference between TCE per ship and net income per ship should tell us the company’s profit breakeven rate for the period. The calculation is beyond the scope of this article because there are a host of adjustments and estimates that need to be made.
Frontline owned 59 crude oil tankers, and it chartered in 8 tankers from other owners. Shipping companies will charter in vessels from other owners if they believe they will be able to earn money by chartering the vessels out to others as charter rates increase. Also note, throughout this article, I will sometimes cite different numbers for vessel counts, with each difference depending on usage. Frontline owned some ships fully and some ships partially, they chartered in some ships, they had 5 newbuildings in 2002, and they also owned 10 ships that weren’t oil tankers. For brevity, I don’t always cite which constraints I’m applying.
Loved this, Tim. You don’t just retell what Pabrai bought — you reconstruct the decision as it looked before the outcome was known.
The charter-rate vs breakeven work is especially good. It turns Frontline from a famous anecdote into an actual investing case study.
Debug the decision, not worship the investor. Excellent work. 🔍