


In Parts One and Two, we discussed the global crude oil shipping industry, the particular risks to Frontline and its shareholders, and what was intriguing about the company. Now, we’ll examine how Pabrai dimensioned the risks to the company, when he made his investment, and how it fared.
Frontline’s balance sheet
We now have a little better understanding of Frontline’s strategy and how it seemed to mitigate the risks around spot chartering and Fredriksen’s cowboy persona. But we still need to understand how Frontline would handle the current downturn.
While history suggested that charter rates would one day recover, there was still the real risk of Frontline generating losses for several quarters of even several years. What if the company suffered losses so great that it exhausted the cash or capital available to it? What if the cycle downturn forced the company to declare bankruptcy?
Pabrai knew this could be a danger, so he turned to the company’s balance sheet. From The Dhandho Investor:
Frontline had about 70 VLCCs at the time… [and] a tangible book value of about $16.50 per share. Even factoring in a distressed market for ships, you would still get a liquidation value north of $11 per share. The stock price had gone from $15 to $3 in short order. Frontline was trading at less than one-third of liquidation value.
Let’s recreate some of the work Pabrai likely did on Frontline’s balance sheet to see if the company was as protected as he said. Below, I’ve reproduced Frontline’s balance sheet as of Q2 2002. The balance sheet shows a book value per share of $15.89, or $1.22 billion, with most of the asset value tied up in ships.
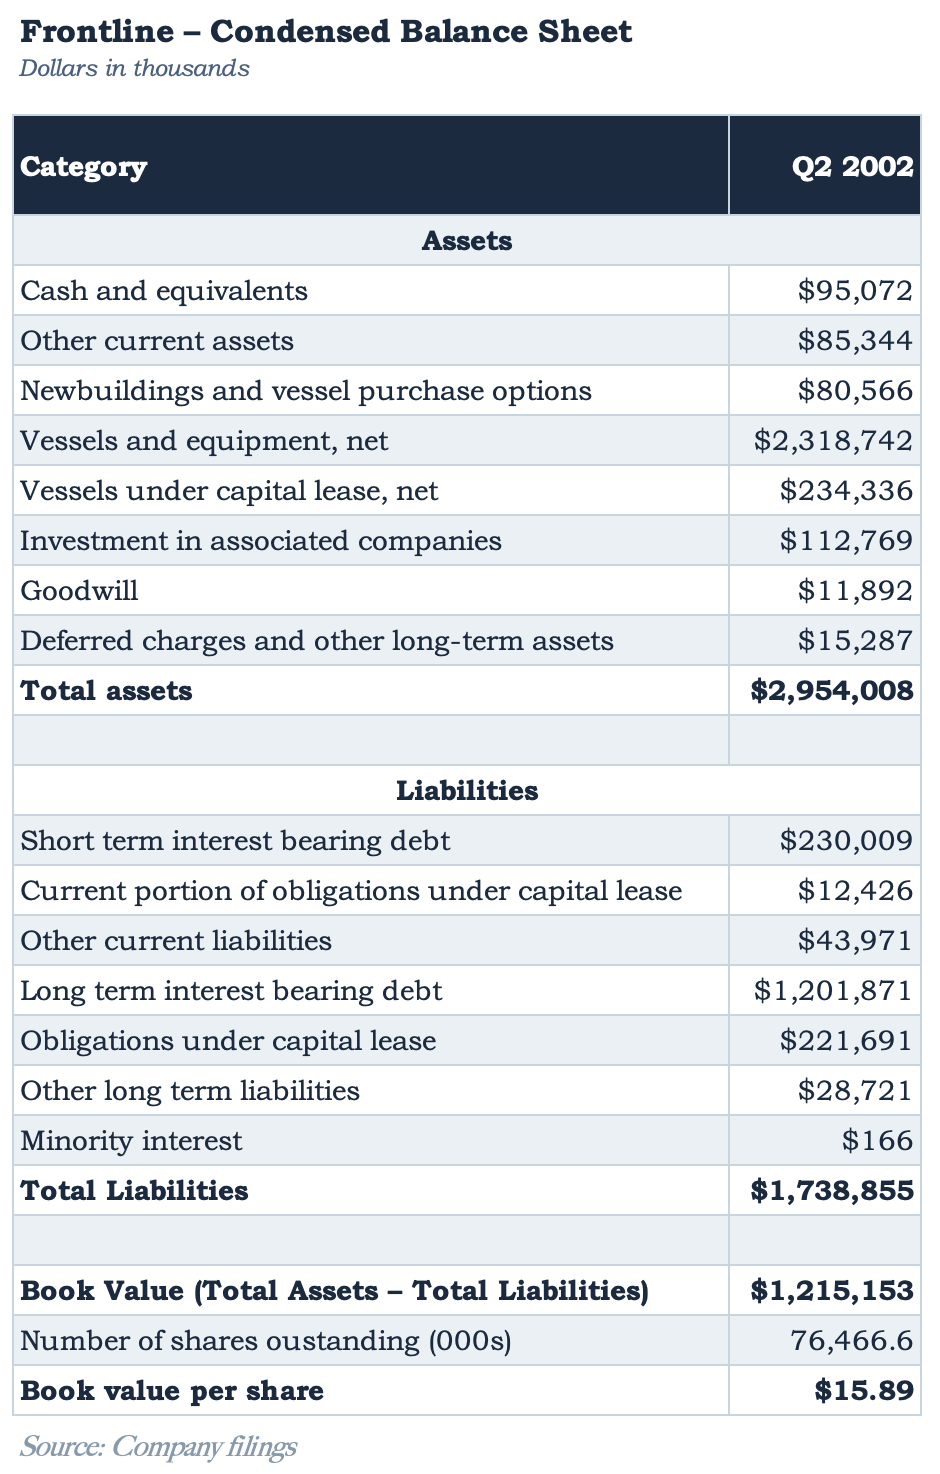
Since goodwill is the only intangible item on the balance sheet and it is small, the book value of $15.89 squares well with Pabrai’s commentary about a tangible book value of $16.50.
But what about the ships? Could Pabrai be certain that the $2.3 billion of carrying value on the balance sheet represented their true value at the time?
Frontline listed 82 ships in total in its 2001 20-F annual filing, with an as of date of June 14, 2002. Of those, 69 were owned or partially owned by the company, eight were “chartered in” by the company from other owners, and five were newbuildings being constructed. (Shipping companies will sometimes charter the boats of others if they think they will be able to charter out the boat to another company at spot market rates higher than the charter rate they paid.)
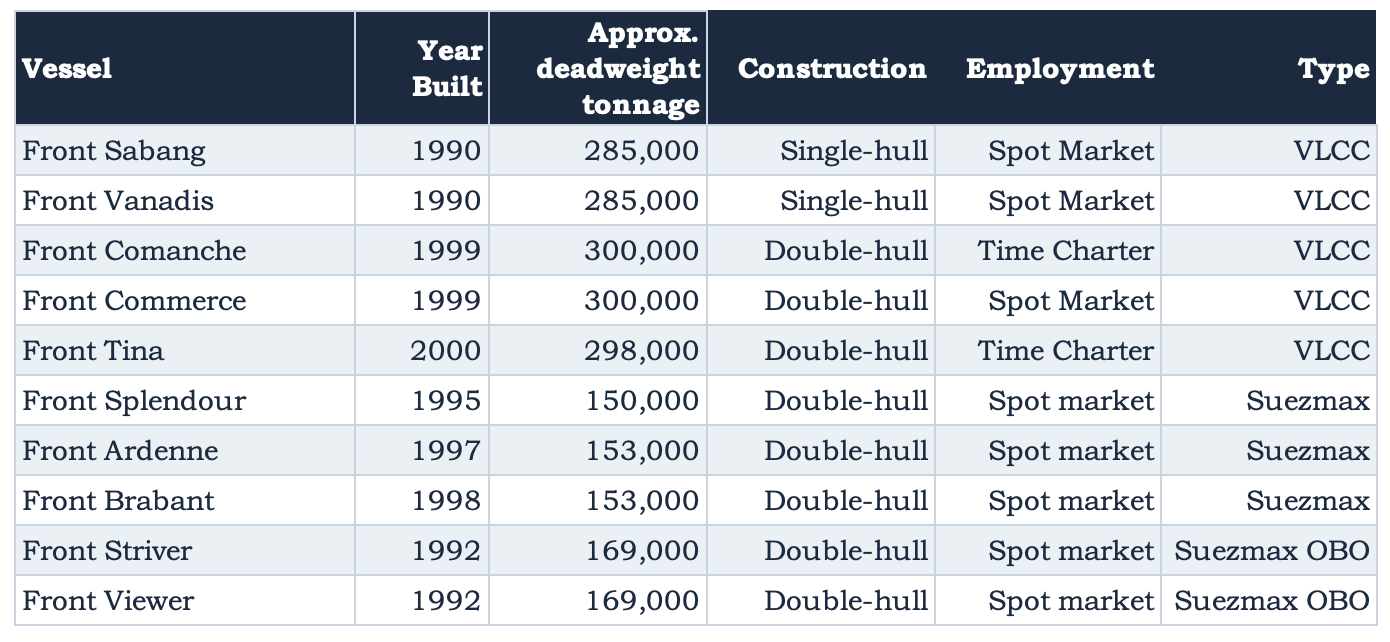
First, by reading the 20-F annual report, we find that the ships were accounted for at historical cost less accumulated, straight-line depreciation (over a life of 25 years). This is a good fact, and should mean that the ships tend to be carried at conservative values.
However, Frontline did not report the market value of each of its ships (only the gross carrying value). So, how could we get a feel for whether Frontline’s balance sheet accurately reflected the current value of the ships? After all, the current environment for charterhire rates was depressed, and it should follow that ship prices would be too. Can we get a feel for how ship values were reacting in the downturn?
The following chart shows just that, once again from the great shipping data resource Clarksons. The chart shows secondhand tanker sale prices for VLCC’s aged five and ten years and around 300,000 dwt in capacity. Frontline’s VLCC tanker fleet averaged 5.6 years in age.
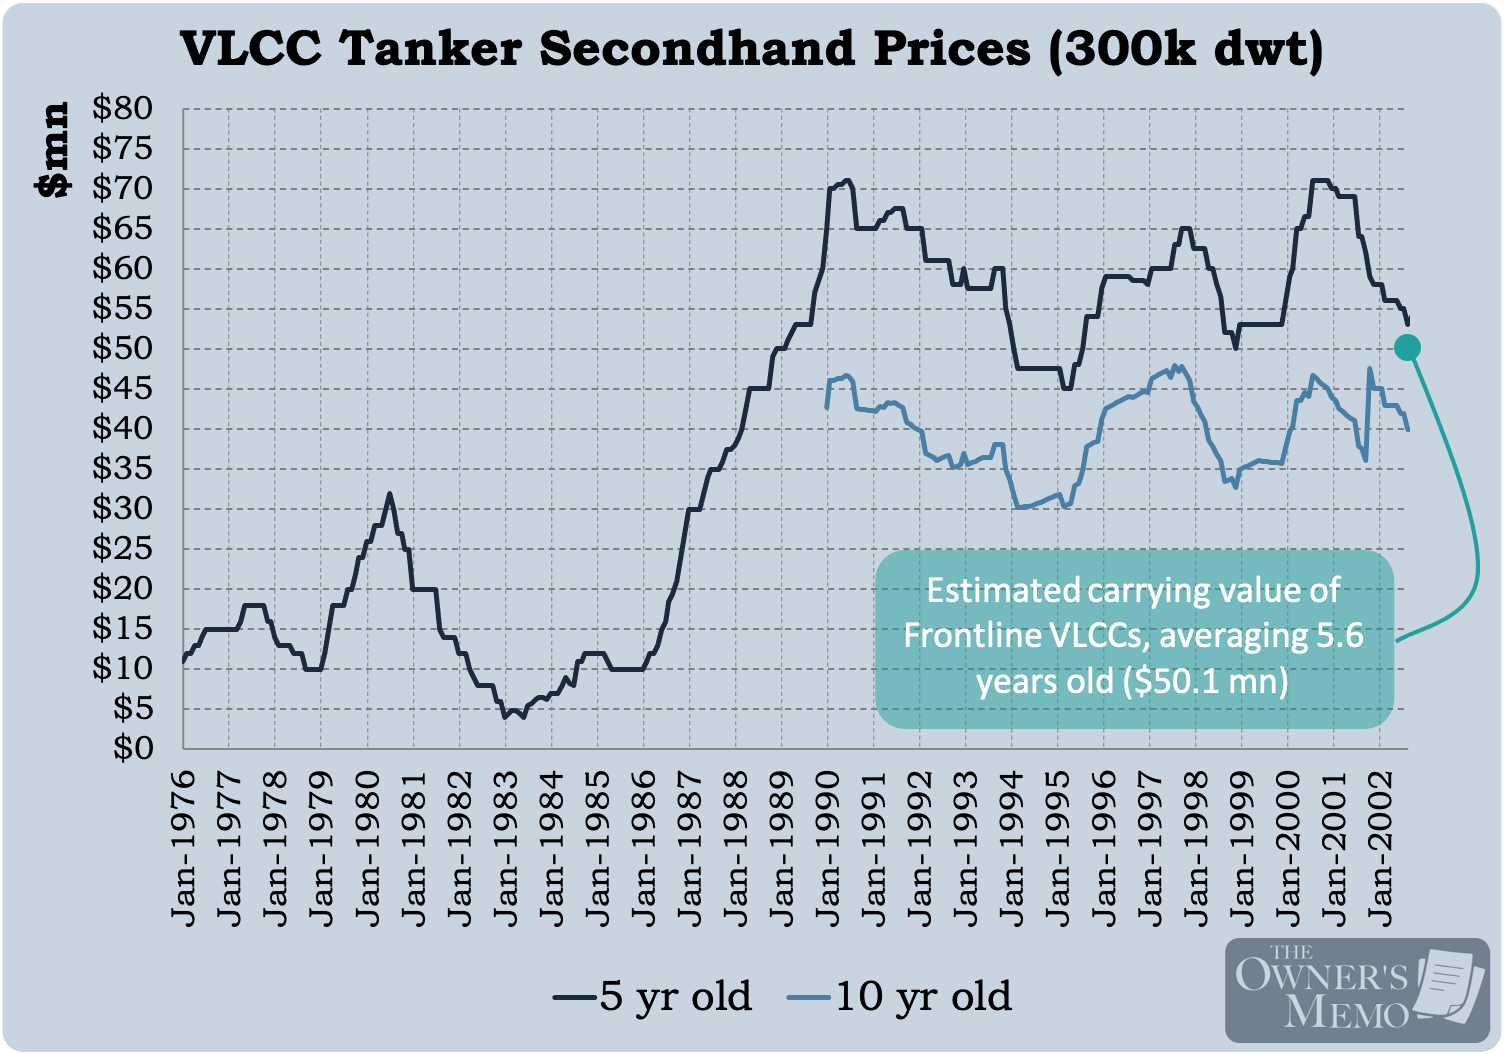
You can see from the chart that VLCC secondary sale prices (for five-year-old ships) hovered in a range between $45 million per ship and $70 million per ship from 1988 through 2002. In the 2001-2002 market downturn, they had fallen to $55 million.
Using this data and other sales data from Clarksons as of August 2002, I bucketed Frontline’s fleet into age groups and ship types, and estimated a value for the entire fleet. That value was $2.30 billion, remarkably close to the $2.32 billion of carrying value as of June 2002.
So, it appears that Frontline was carrying its ships pretty close to the values they would fetch on the secondary market in September 2002.
But what if there was a further downturn? Would Frontline be able to survive? Would it be able to generate the cash needed to ride out the market cycle trough?
Frontline generated more cash than it appeared
In his explanation for making his investment in Frontline, Pabrai acknowledges the shipping cycle downturn of 2002 and that, if the downturn continued, Frontline could simply raise cash by selling ships. That seems like a rational argument given what we just uncovered about their fleet value. Pabrai from The Dhandho Investor:
…if [Frontline] sold a ship, it would raise $60 million. The total annual interest payments were $150 million. It could sustain the business at $6,000 a day rates for several years by simply selling two to three ships a year.
As we’ll see, Pabrai’s interpretation here is a little generous, but his point is still valid. Frontline had a strong balance sheet and could sell ships to help it manage through a downturn.
In addition, there is another feature of Frontline’s business model that Pabrai doesn’t mention: even when Frontline was generating losses, the company generated a lot of cash. Why? Because Frontline, by virtue of the large number of ships it owned, bore a large depreciation expense that flowed through net income. Naturally, Frontline’s cash flow statements added back this non-cash expense, such that, even in periods when Frontline generated losses, it still generated positive amounts of cash.1
There is no better period to see this, perhaps, than the first half of 2002. Frontline lost -$16.9 million in net income during the period but generated $69.4 million in cash from operations. This was a period when TCE rates were slightly below Frontline’s profit breakeven rate.
A comparison of Frontline’s income statement and its cash flow statement from 1H 2002 is shown below.
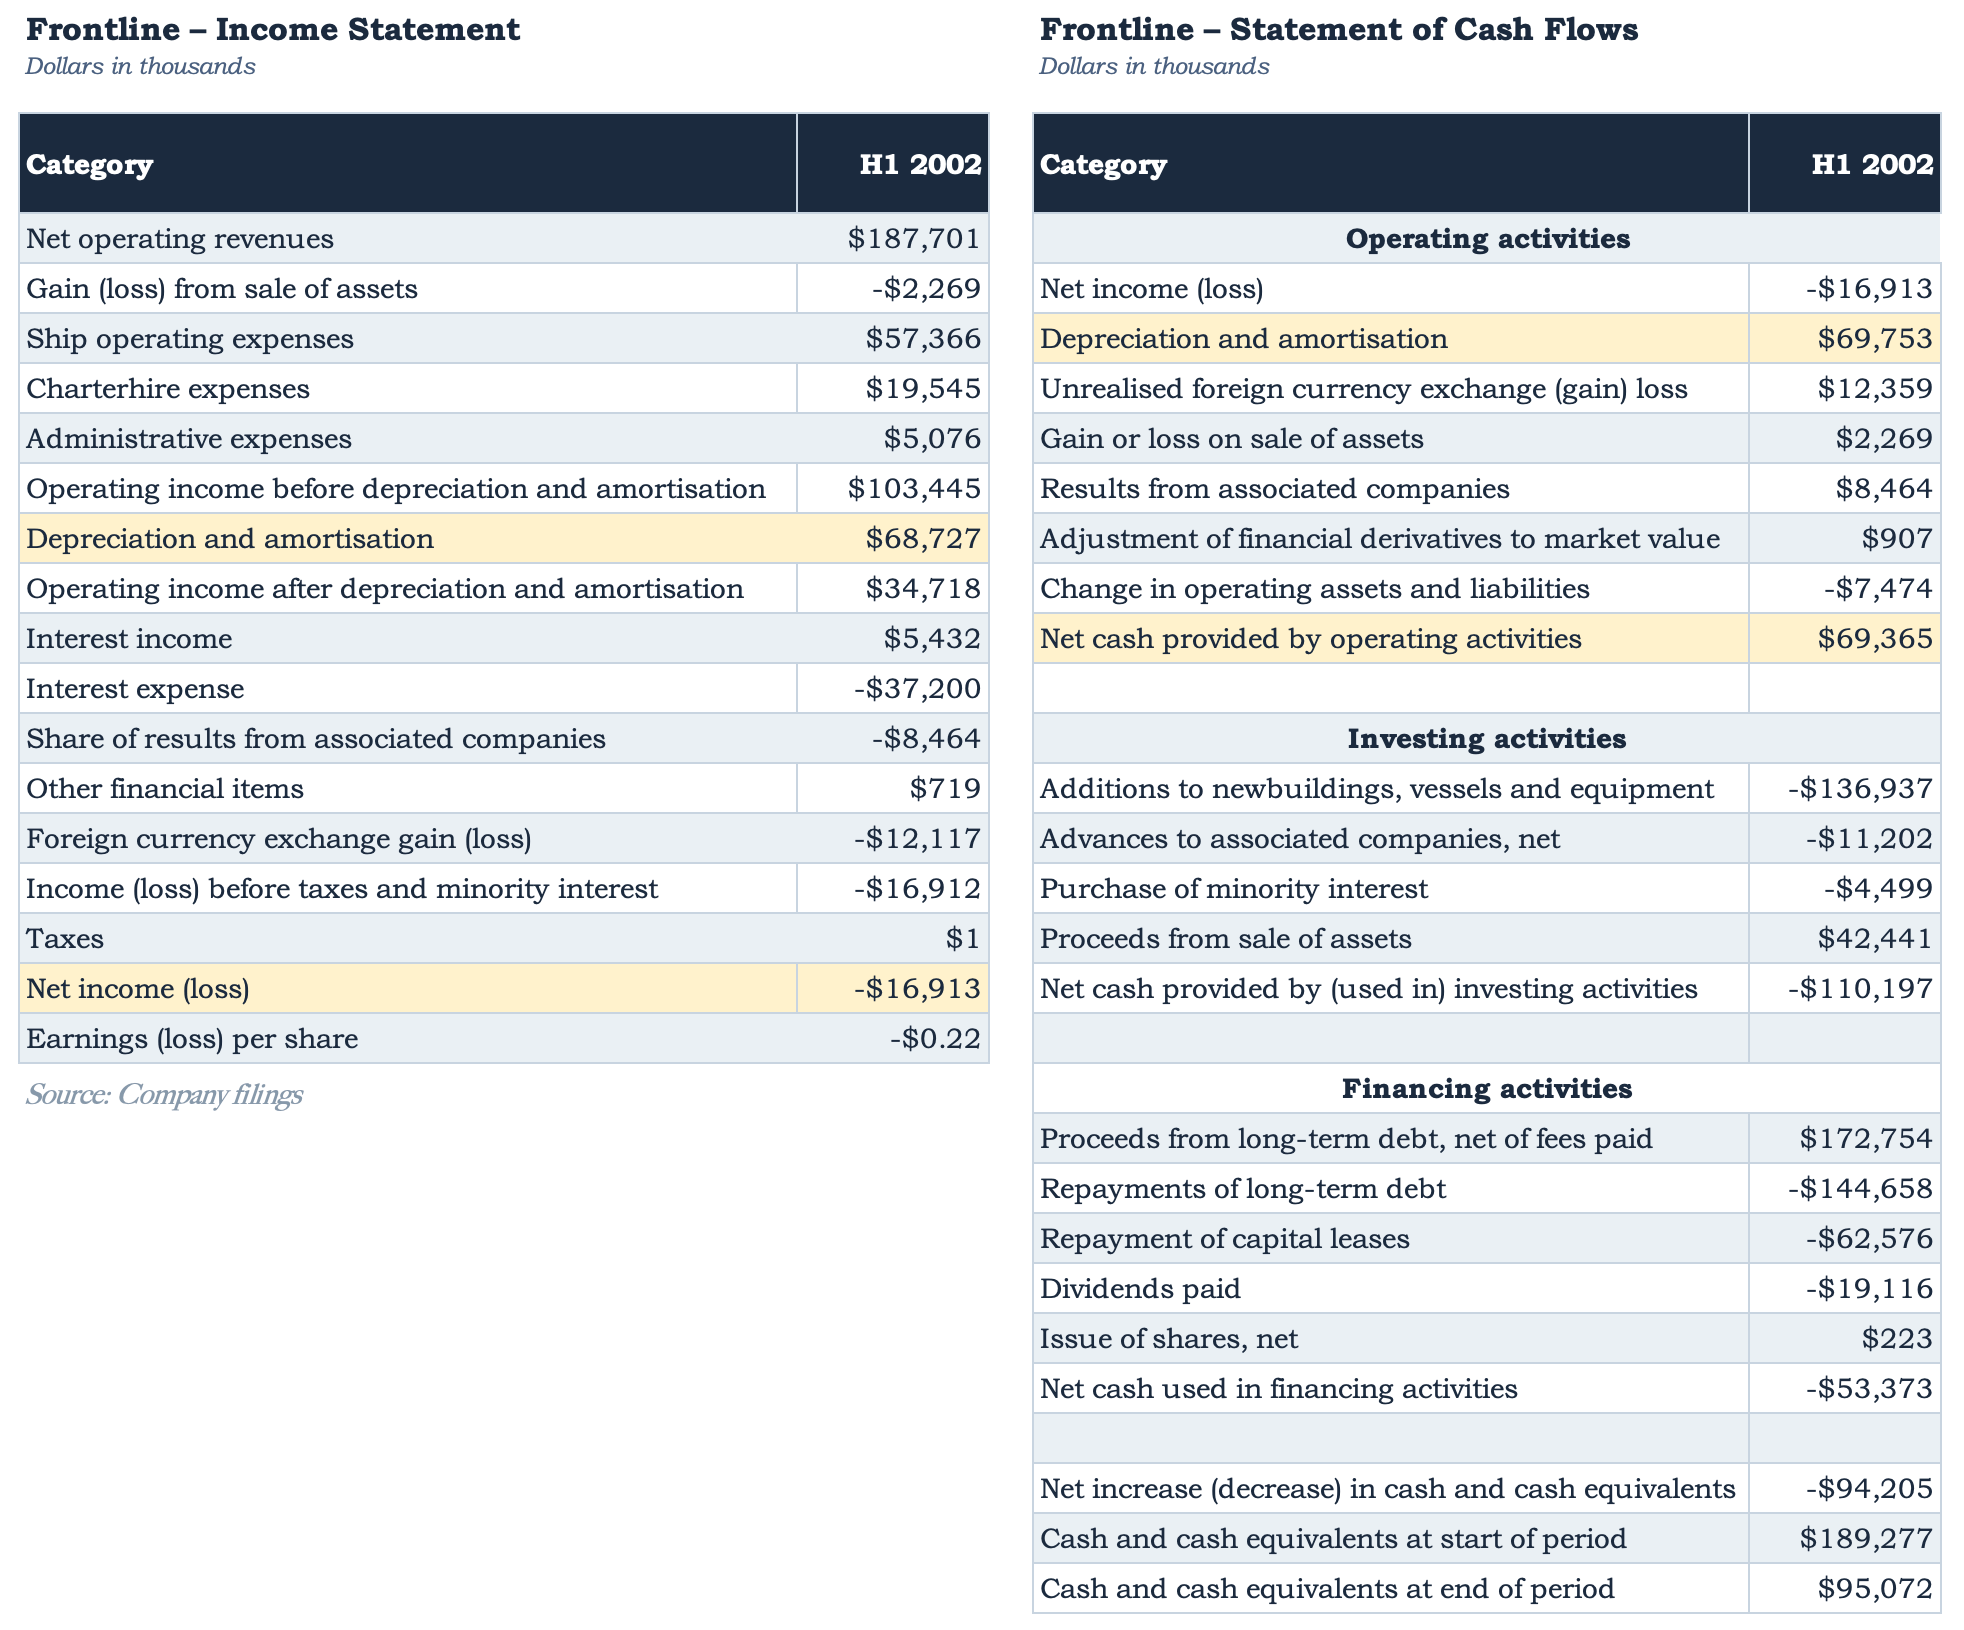
So, Frontline was in a better position than its net income and profit breakeven figures would indicate. Yes, the company needed to make a positive net income to be long-run sustainable, but in a cycle downturn, the company’s high depreciation expense meant that it was generating more cash than it otherwise seemed, which could help it weather the storm and continue to meet its obligations.
Importantly, we can even estimate the level of charter rates that the company would need to suffer to be cash flow breakeven, as opposed to profit breakeven. Taking the company’s H1 2002 cash flow statement, zeroing out non-recurring items, using the profit breakeven rate, and recalling the number of vessels the company owns produces a pro forma cash flow breakeven charter rate of $14,475 per vessel per day, nicely below the $17,400 profit breakeven figure.
How long could Frontline survive?
With this in mind, can we get a feel for how long of a downturn Frontline could survive if necessary?
The company ended the first half of 2002 with about $180 million in cash and current assets against $286.3 million in current liabilities. (Most of this was in the form of short-term debt, which I imagine Frontline was in the process of refinancing given the relative strength of its balance sheet. Let’s ignore this $106.3 million obligation for the moment.)
Can we apply some stress to Frontline’s balance sheet to get a feel for just how healthy or not the company was? That is a bit subjective.
Let’s assume for the moment that charter rates drop to $10,000 per day, which is the lowest level they saw over the prior 12 years, and let’s assume they stay there for some extended period (which seems pretty draconian). Then, with Frontline’s cash breakeven rate of $14,475 and with just over 75 vessels owned and chartered in (accounting for partial ownerships), the company would be burning through about $120 million per year.
On top of that, the company had debt coming due. Here is the debt maturity schedule from the company’s 2001 20-F report.
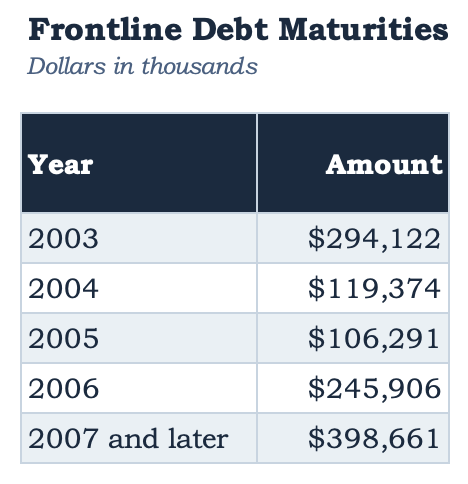
So, let’s imagine the year 2003 in a draconian charter rate environment of $10,000 TCE rates. The company would burn through $120 million in operating expenses and it would need to come up with an additional $294 million to pay down its maturing debt (assuming that it could not refinance that debt). That’s a total $414 million of cash the company would need.
Frontline’s $1.20 billion of debt was almost all floating rate debt indexed to LIBOR and collateralized by its vessels. To be clear, in just about any environment (even cycle downturns), the standard procedure for these debt maturities would be for Frontline to refinance its debt with its banks as long as the company was still meeting financial covenants and amortization payments. But we are trying to stress test Frontline’s ability to weather a financial storm, so let’s imagine that it was cut off from refinancing and needed to sell some ships to meet its cash and debt maturity obligations.
How many ships would the company need to sell to come up with our hypothetical $414 million cash shortfall in 2003?
The answer depends on how much it could sell ships for. Recall from earlier that we estimated the current value of Frontline’s fleet in September of 2002 at $2.30 billion, very close to its carrying value. Against that $2.30 billion, Frontline carried $1.20 billion of debt, most of it mortgages against those ships. I’ve reproduced Frontline’s balance sheet from earlier (Figure 15). The loan value ($1.20 billion) versus the market value ($2.30 billion) tells us that Frontline was carrying debt that was 52% of its vessel value.
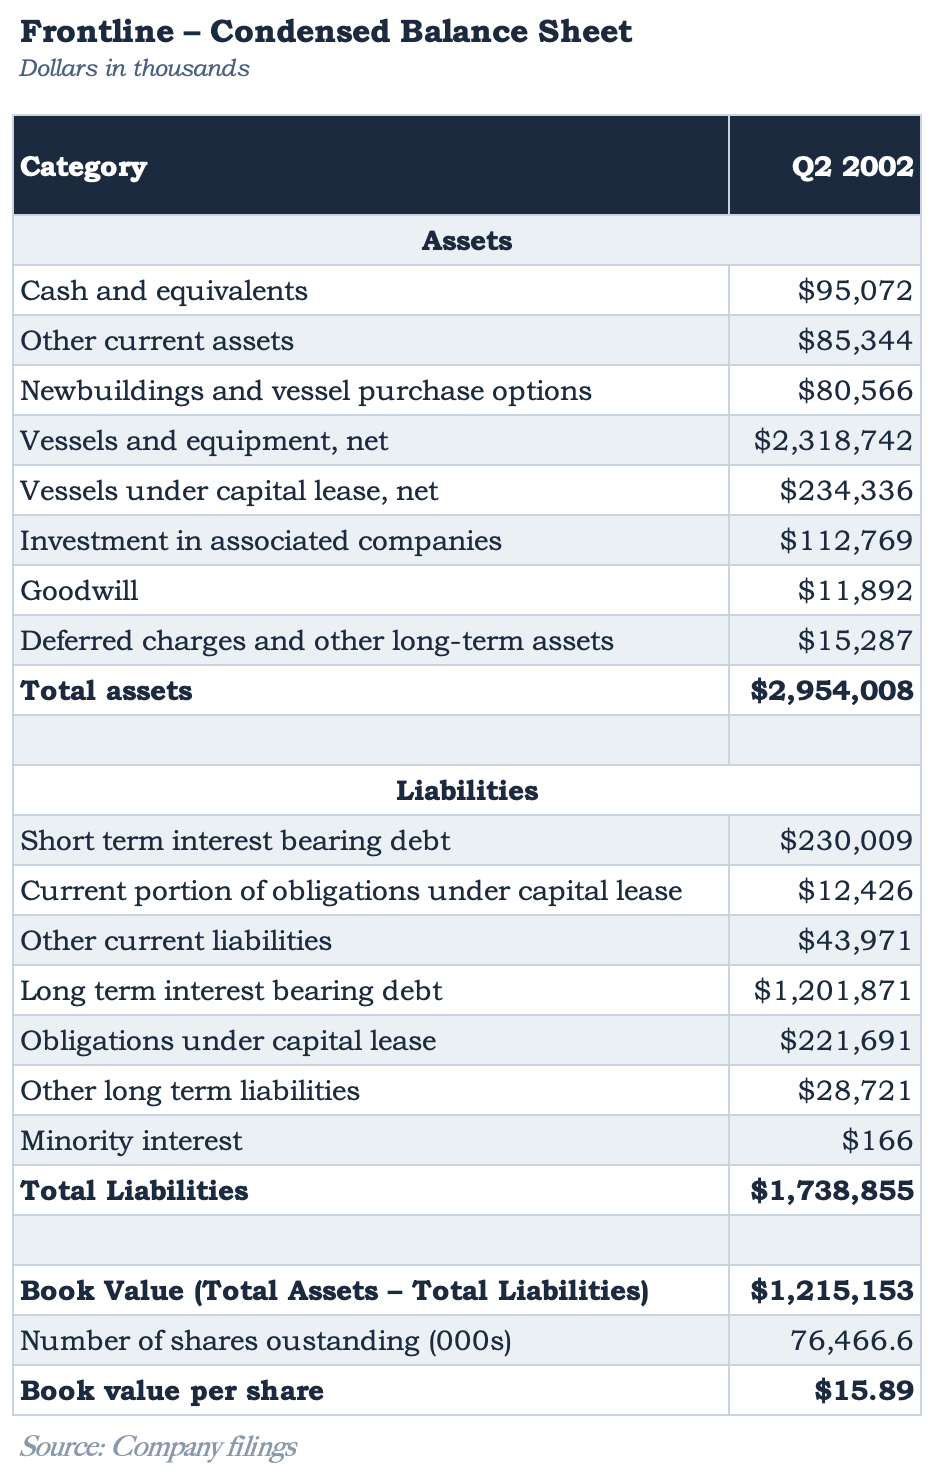
In other words, at current market valuations, Frontline could sell a ship, allocate 52% of the proceeds to paying down debt, and use the remaining 48% to fund its operations.2
Let’s simplify the analysis a little by focusing on Frontline’s VLCC ships, the market price of which we saw earlier in Figure 17. Let’s take Figure 17 and imagine how much cash the company could generate with tanker secondary values at three levels for an extended period. I’ve called those levels “Stress #1” “#2” and “#3”, and they correspond to five-year-old VLCC prices being (1) at the current market value of $55 million, (2) down 24% to $42 million, and (3) down 45% to $30 million.
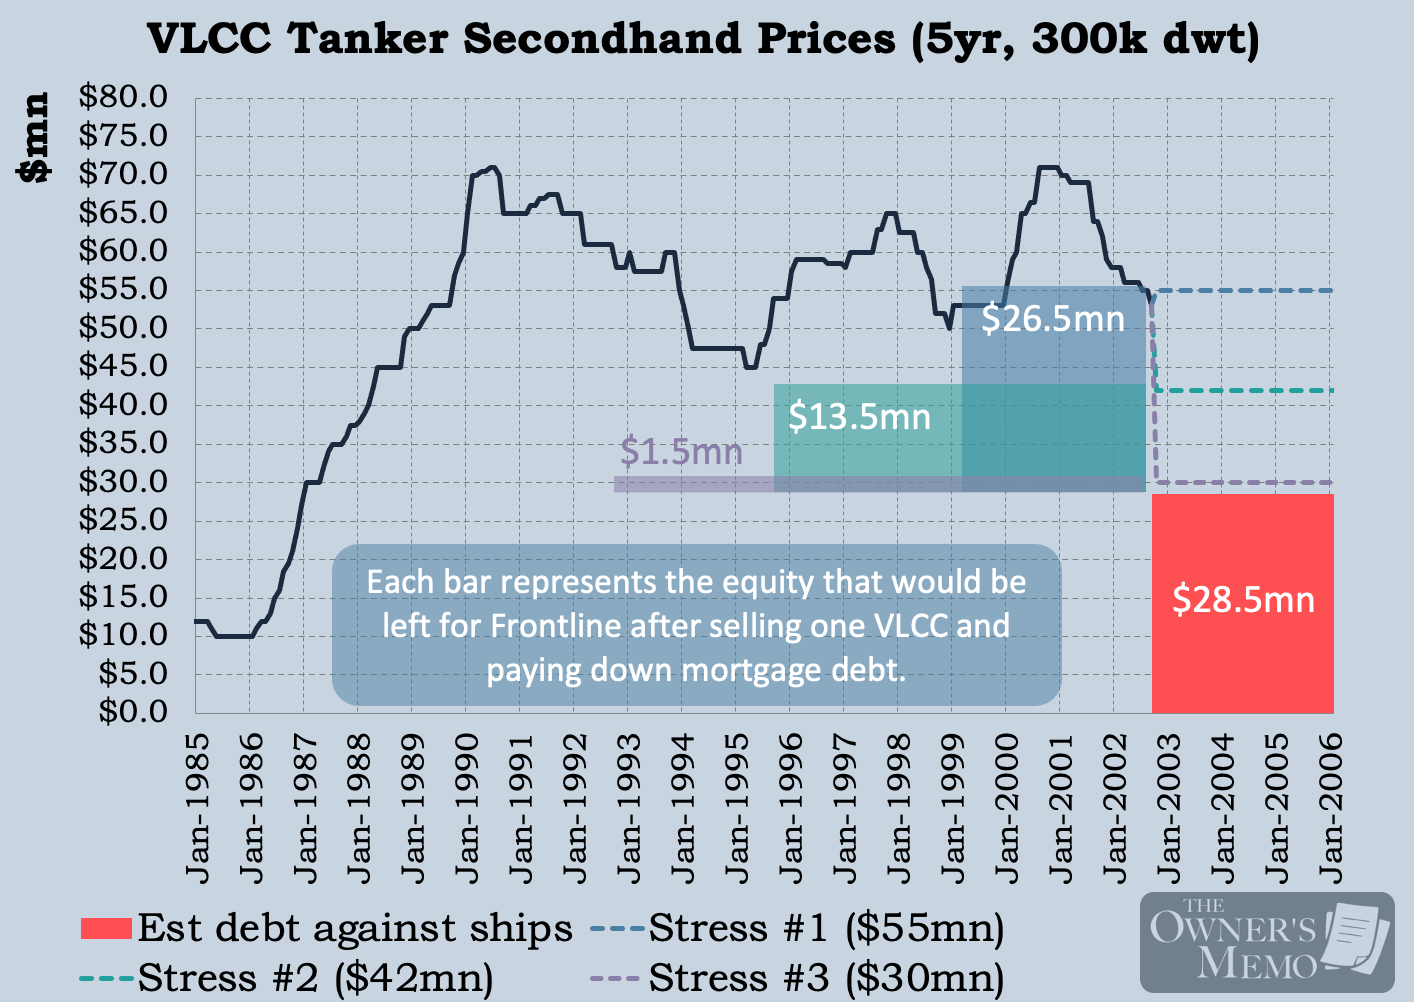
The bars in Figure 20 represent how much equity Frontline would generate for itself from the sale of a VLCC vessel at each level of pricing and helps us understand how much distress (or lack thereof) Frontline was facing.
In stress scenario #1, which assumes the current market pricing (in this case, $55 million for a 5-year-old VLCC) holds for the next few years, Frontline could sell a ship, pay off the approximately $28.5 million of debt collateralized by the ship, and keep $26.5 million in cash for the company. In that scenario, surviving our distressed 2003 scenario of $10,000 charter rates and coming up with more than $414 million could be doable by selling nine VLCC’s of various ages. (In this scenario, banks would almost certainly be working with Frontline on refinancing, forgoing even the need to sell.)
In stress scenario #2, which sees 5-year-old VLCC prices down 24% to $42 million (and down 41% from their peak), the company could generate over $414 million by selling eleven VLCC’s, not ideal, but very well doable. (Whether Frontline’s banking partners would allow the company to refinance in a scenario like this depends heavily on circumstances.)
What about scenario #3? In that scenario, selling sixteen ships would generate proceeds of $437.5 million, but almost all of it would go toward paying down mortgage debt. The company would only be left with $21.8 million in equity, not enough to meet its operating costs for the year. That is obviously a very bad situation for equity holders, and the company would be beholden to the mercy of its bankers to extend it more credit to muddle through the difficult times. A bankruptcy and liquidation at values like these would mean a near complete wipeout of equity holders.
Pabrai’s bet
Now, we have a pretty good fundamental understanding of what Mohnish Pabrai saw in Frontline in September 2002. While a scenario like #3 above would be bad, Pabrai assessed that it was likely remote and Frontline and its stock had a lot going for it:
A company trading at less than half its (accurately stated) book value
One that generated cash even as it produced income statement losses
A new, mostly double-hulled fleet purposely acquired to benefit from the single-hull scrapping trend and resulting vessel supply pressure
A strong balance sheet able to survive charter cycle downturns (although not incredibly severe ones)
A company designed to benefit to the maximum in cycle upturns, reflecting the personality of its unique CEO.
All these things made Pabrai pretty comfortable that a purchase of Frontline’s equity in September 2002 was a pretty good bet. While there was some small, non-zero chance that the company might not survive, the fundamentals seemed to favor a more modest cycle downturn, and, if that was the case, Frontline was dramatically undervalued.
At a purchase price of, for example, $5 per share, Frontline would have been trading at a market capitalization of $382 million, which was almost exactly equal to the income earned by the company in 2001. That year was a great one for charter rates, but even so, if charter rates reached the more modest level of, say, $30,000 per ship per day, with a profit breakeven rate of $17,400 per ship per day, Frontline would still be earning roughly $300 million.
In a nutshell, that was Pabrai’s bet: that Frontline was way too cheap for a well-protected company and one that was purpose-built to benefit from the upside.
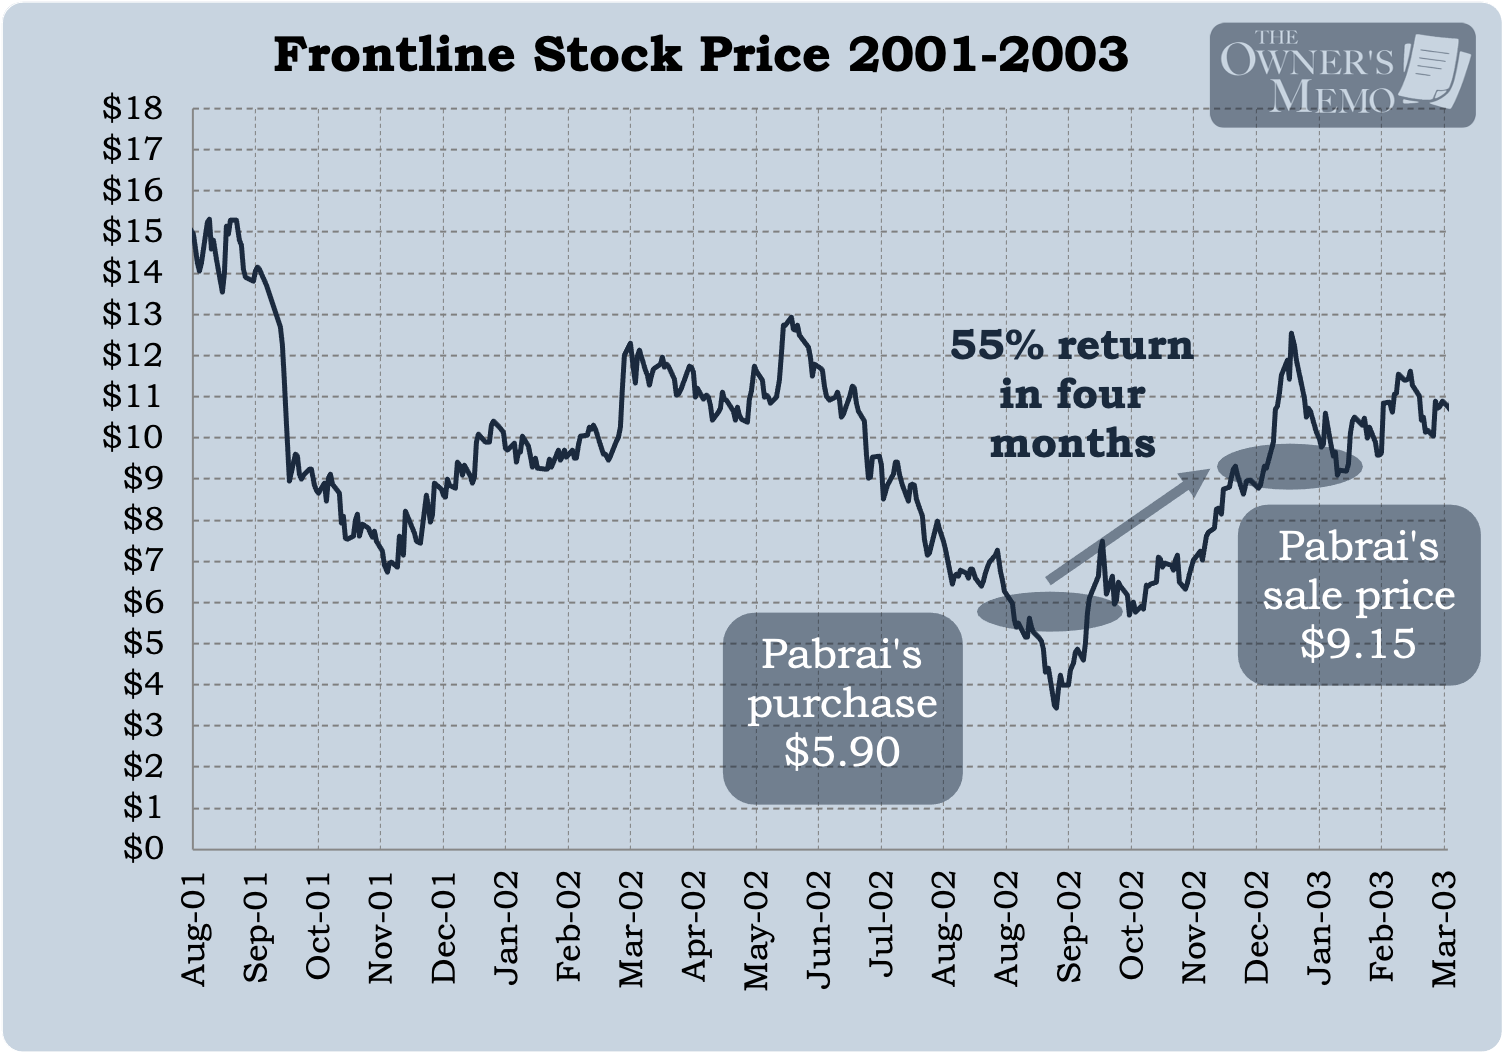
Pabrai purchased Frontline’s stock at an average price of $5.90 per share in the fall of 2002. From his interview with Shaan Puri:
I put 10% of my fund into Frontline because I just couldn’t see a way that we could lose money.
Pabrai makes 55% on his investment
Almost immediately after Pabrai made his investment, the cycle for shipping started to recover. According to Clarkson, tanker charter rates rose from the low levels of $12,761 per day in September 2002 to $47,000 per day in December and as high as $64,000 per day in March 2003.
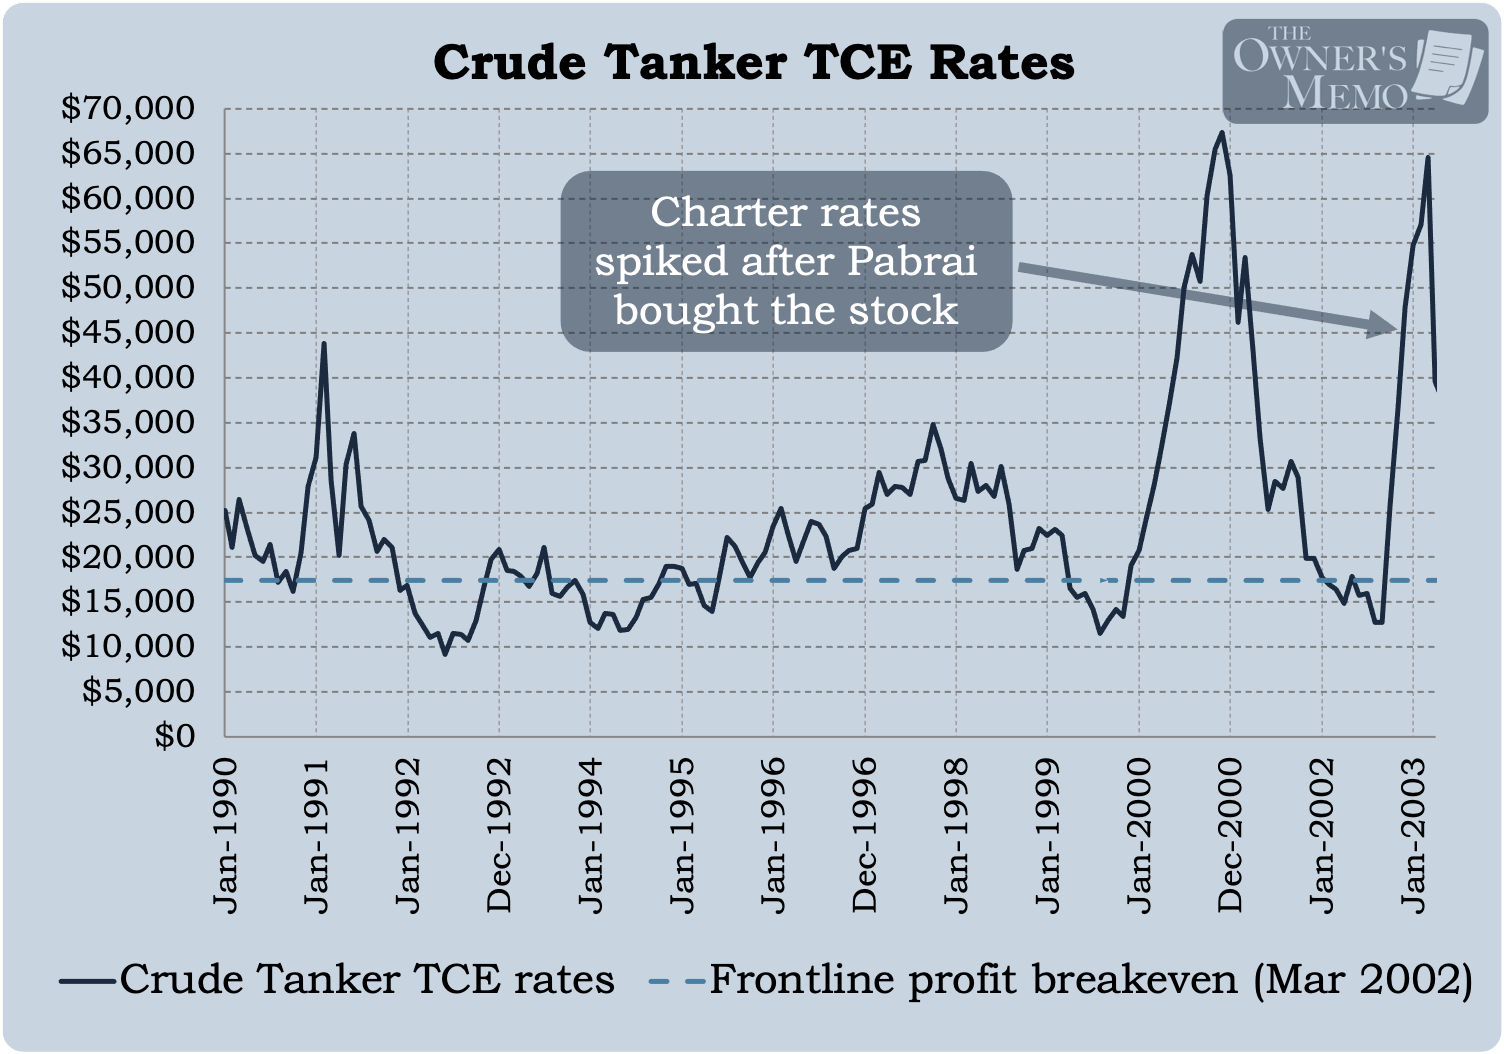
And Frontline’s stock price followed suit. It quickly rose from the September low of $3.43 to much higher levels in the subsequent months.
Pabrai, knowing charter rates at those levels were high relative to history, chose to sell his stock at an average sale price of $9.15, good for a 55% return over four months of time. Here is Pabrai again in The Dhandho Investor:
Once we got past $9, approaching $10, I started to unload shares. The whole thing happened in a very short time period, resulting in a very high annualized rate of return… of 273 percent.
What happened next? A word of caution
Now, Pabrai’s investment seems like a great trade, and, indeed, it was very good.
But what happened subsequently provides another lesson to be learned from this case study. You see, the tanker supply dynamics we studied earlier (an undersupply of ships driven by the scrapping of single-hulled tankers) took hold in full force and charter rates rocketed higher than ever before.
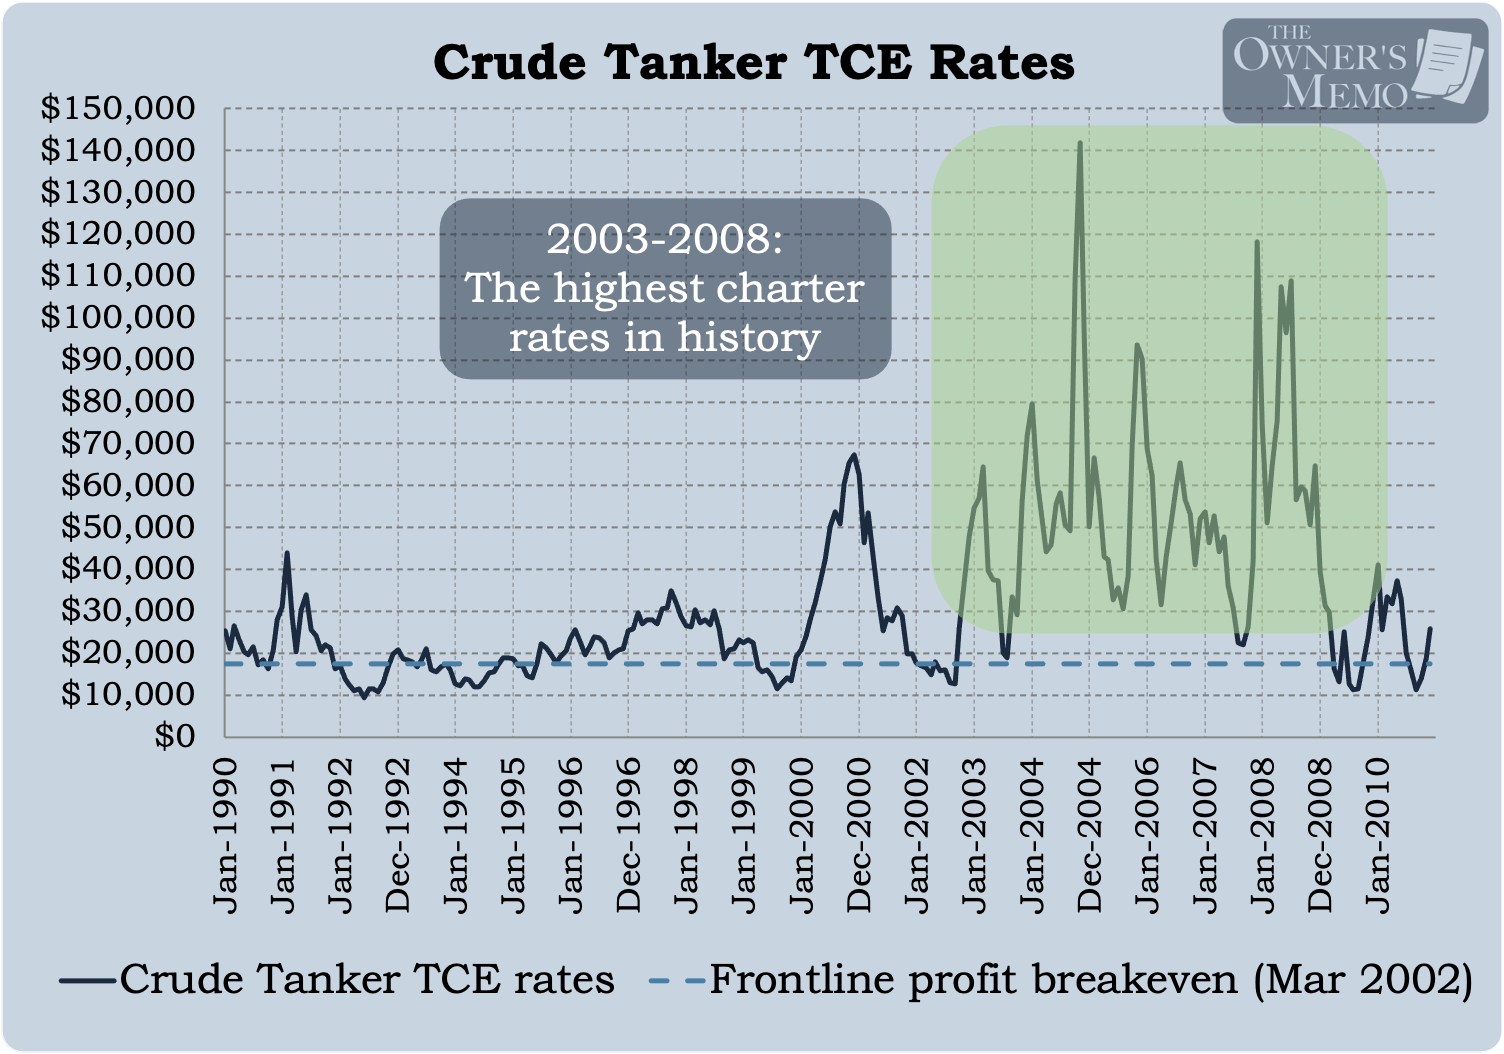
From 2003 through 2006, tanker charter rates averaged $55,100 per day, briefly touching as high as a mind-boggling $140,000 per day. This was a boom time for Frontline. In each of those years, the company made net income of $409.4 million, $1.02 billion, $606.8 million, $516.0 million, each figure more than the pro rated amount Pabrai had paid for the entire company in the fall of 2002.
And the stock price followed.
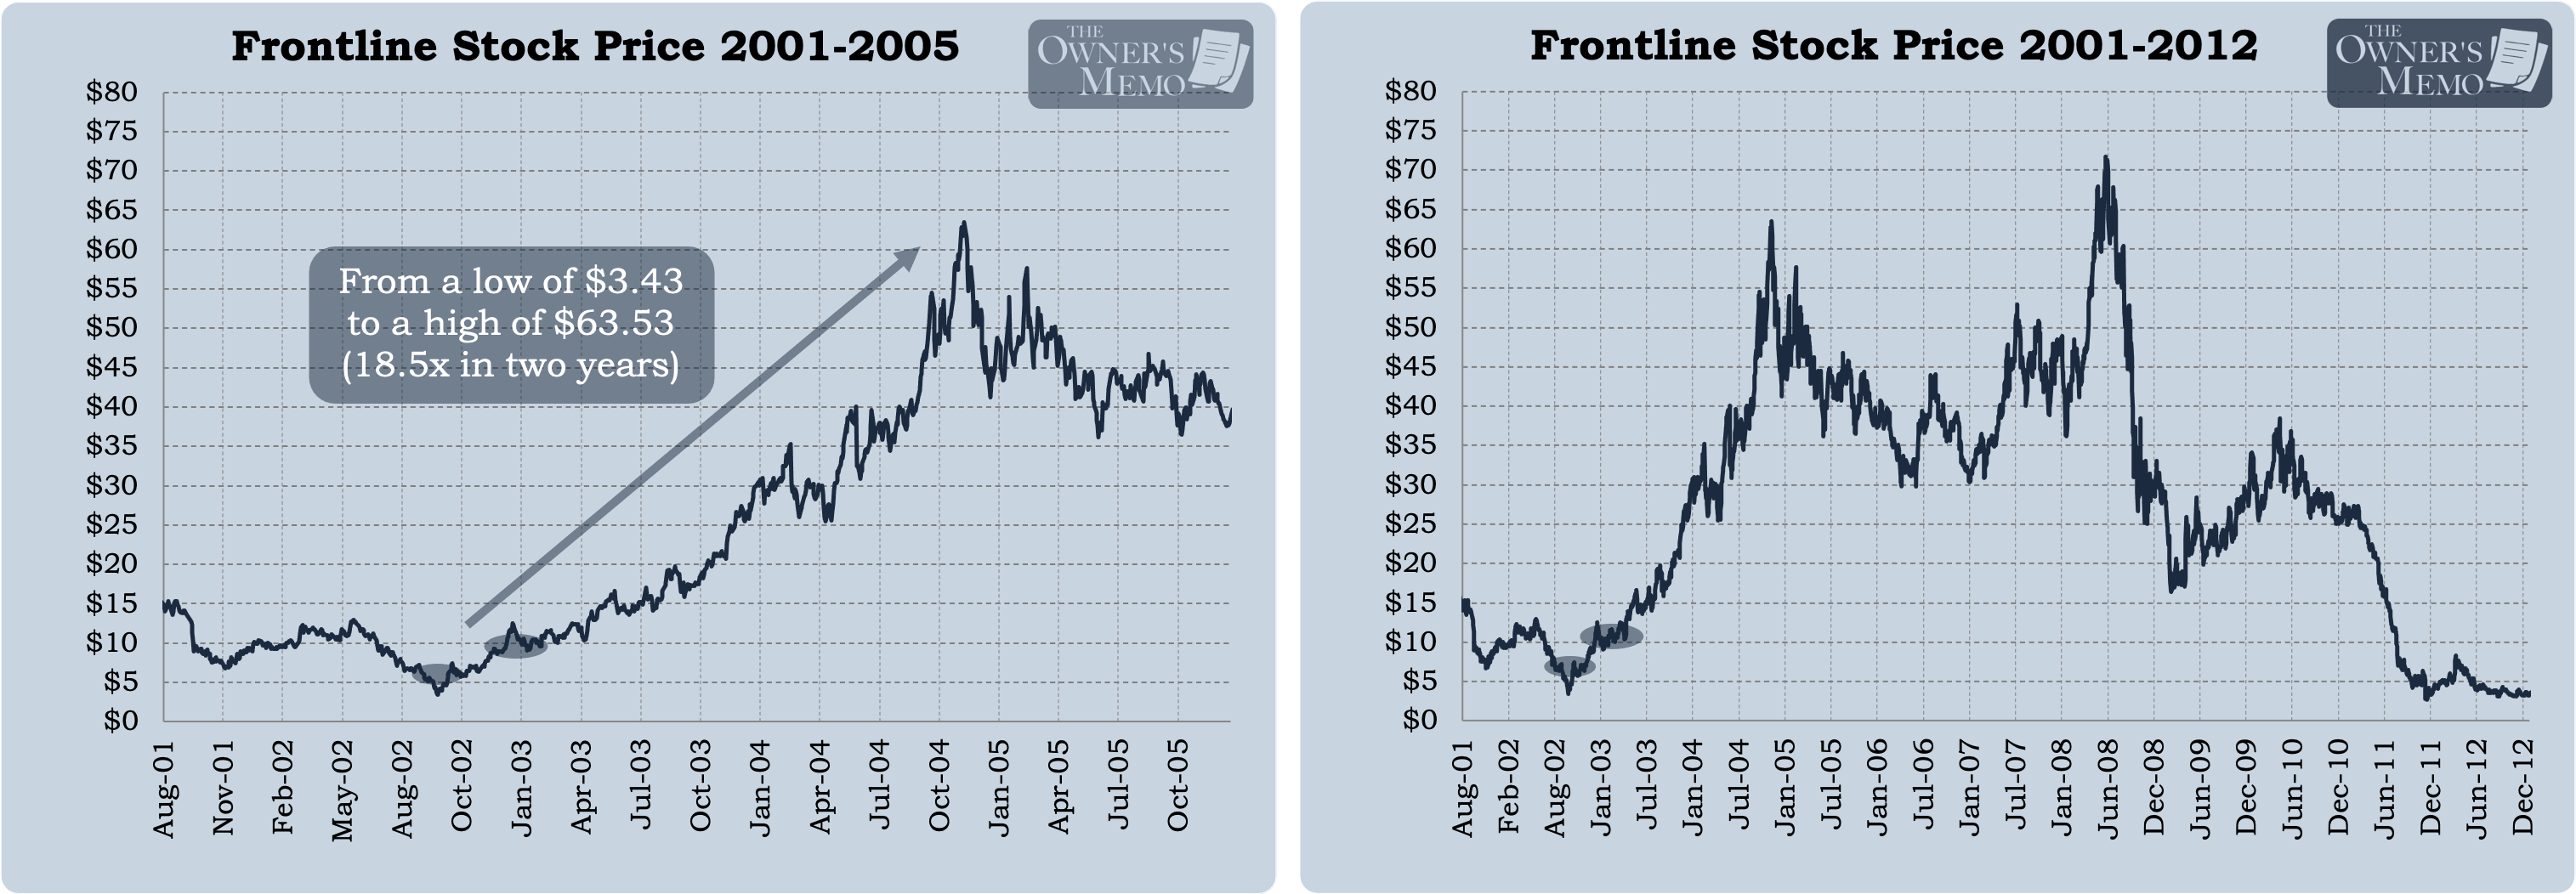
For Pabrai, this was a particularly difficult lesson. He made a fantastic 55% return on his investment in just four months time, but forewent a potential 10 times return on his $5.90 investment. Here is Pabrai again from his interview:
I didn’t make even 3% of the money I should have. Okay? You know, I mean, it was given to me on a platter and I blew it. I still made money, but… the best ideas when you finally figure them out, they’re very simple.
That was an example of where I did first order thinking but I did not do second order thinking... We had this dynamic, if I had thought about it, that once the demand became tight you really couldn’t increase supply for at least 3 or 4 years… when that price is not going to come down. It’s only after 3 or 4 years more ships start getting delivered and you start getting more balance and all of that. That’s an insane amount of cash flow.*
Personally, I find Pabrai’s humility here pretty incredible. Most investors wouldn’t have the confidence to broadcast to others that a pretty good investment should have been a stupendous one and that they “blew it”.
The lesson I take away from this end to the case study is to beware of anchoring your view of value on the price you paid for a stock or, for that matter, any price in the market. The only thing to be considered are the future prospects for the company versus the current price of the stock and any competing investments in which to put your money.
Buffett once said something along these lines. He was warning students not to get attached to their investments, but his message reads just as well as encouragement to disregard what I paid for a stock in assessing a decision to sell.
The stock doesn’t know you own it. Stock just sits there. It doesn’t care what you paid. It doesn’t care that you owned it or anything. So any feeling I have about the market is not reciprocated.
- Warren Buffett, lecture at the University of Florida, 1998
Summary and takeaways
The work Pabrai did to understand Knightsbridge in 2001 did not result in an investment at that time, but it helped him immensely when the industry, particularly Frontline, suffered a downturn in 2002. In investing, any knowledge I accrue is cumulative and can help me in the future. Read curiously and study continuously. Having as many models in my head as possible about how various businesses work could be very profitable at the right times.
Frontline’s stock price dropped quickly and precipitously in 2002. It went from $12.94 in May 2002 down to a low of $3.43 in September. But the decline was brief, with the stock price below $5 per share for only two weeks and four days. It quickly rebounded, and by the end of November, the price was $7.02. Being prepared in advance was crucial for Pabrai to act quickly and decisively when the time came. As an investor, I need to be prepared at all times for wild opportunities to present themselves and cognizant that they may disappear quickly.
Pabrai’s investment in Frontline is a great example of how to invest in a cyclical industry. I am not an expert on the shipping industry. Doing things like trying to call a bottom in the cycle of any given industry is very hard to do. I should be reserving any investment for those times when prices are very low (like being 50% of the company’s accurately-stated and liquid book value) and the company has obvious protections against an extended downturn (like Frontline having an inventory of ships mostly unencumbered by long-term charters).
In addition, as much as possible, wait for the perfect pitch. Pabrai’s investment in Frontline wasn’t simply a bet that the cycle would turn. He had a rational analysis that the cycle bottom should be shallow because single-hulled ships needed to be scrapped in the coming years, and that would limit tanker supply, pressuring charter rates upward. Moreover, Frontline was purpose-built to withstand a downturn while maximizing upside in the upturn. Try to resist accepting less-than-great situations, instead waiting for those for which almost all factors are pointing in the right direction.
References:
Stopford, Martin. (1997). Maritime Economics (2nd edition). Routledge.
Stopford, Martin. (2009). Maritime Economics (3rd edition). Taylor & Francis.
McCleery, Matt. (2012). The Shipping Man. Marine Money International.
A perceptive investor will ask here, “What about capital expenditures to maintain the ships?” Those expenses tend to be already bucketed in Frontline’s income statement as “Ship operating expenses”.
In practice, selling a ship and paying down debt proceeds could involve a negotiation between Frontline and its bank lenders or a redrafting of some existing lending covenants or terms, but as long as Frontline was seeking to repay its debt on time, I’m making the simplifying assumption that the banks would work with the company on this.