


This is Part 1 of a three-part series examining Michael Mauboussin and Dan Callahan’s work on Return on Invested Capital. Today’s piece features one interesting potential investment idea that I discovered while breaking down and updating their work.
Parts 2 and 3 will continue the work and identify three more potential ideas.
Over the long term, it’s hard for a stock to earn a much better return than the business which underlies it earns. -Charlie Munger1
What’s written above is one of my favorite investing lessons. It’s a simple statement, which also accords with Munger’s advice to “take a simple idea and take it seriously.” If a business can earn high returns on the capital it uses (and it can continue redeploying those returns at similarly high returns), then the returns to the company’s stock should follow suit.2
Michael Mauboussin is a long-time business and investing analyst whose work is singular in the space, clearly written and packed with lessons and insights. He has written some great pieces outlining the fundamentals of return on invested capital, some of the strategies companies employ to create high returns, and detailing the character of specific, modern companies in that regard. Here are three of Mauboussin’s pieces, written with co-author Dan Callahan.
ROIC and the Investment Process (June 6, 2023)
Return on Invested Capital (October 6, 2022)
Calculating Return on Invested Capital (June 4, 2014)
Decomposing Return on Invested Capital
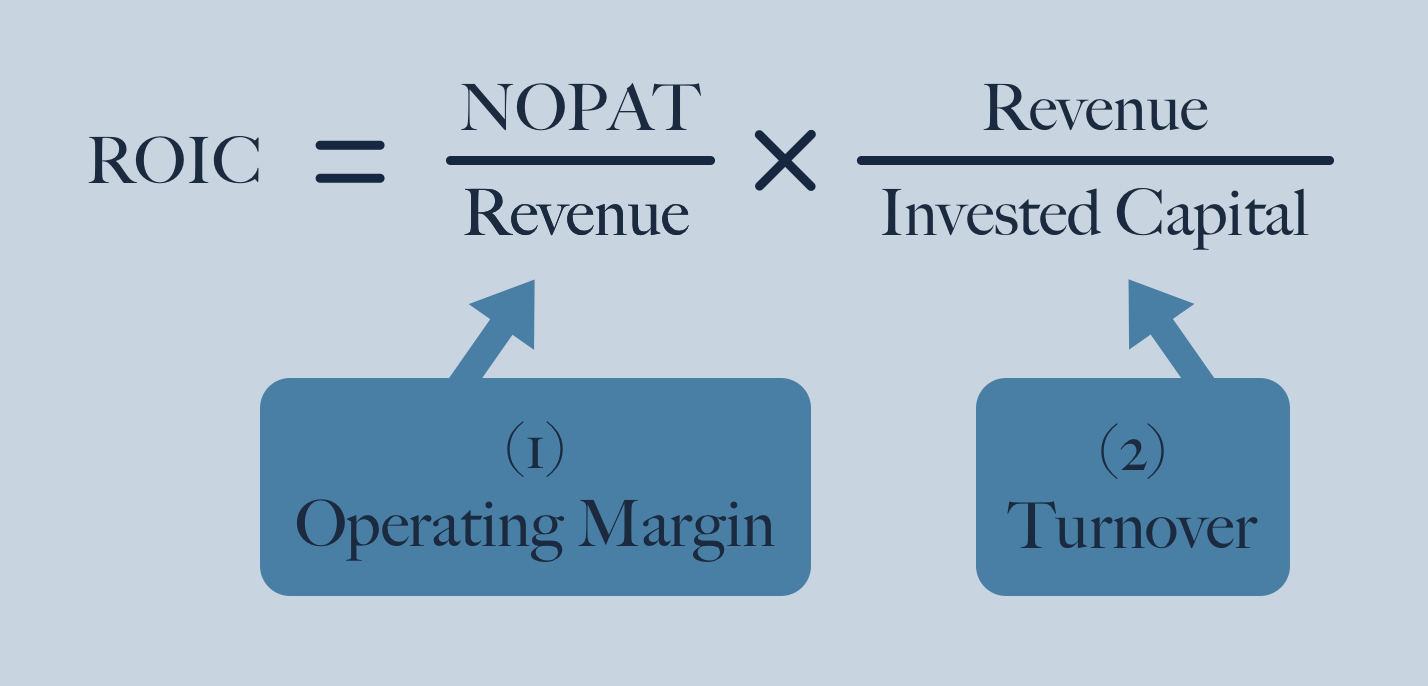
In each of these papers, Mauboussin and Callahan make the point that the return on invested capital that a company generates can be decomposed into two separate terms. The authors first walk through a simple definition of ROIC:
Then, they point out that the expression is equivalent to two other expressions:
The first expression is relatively straightforward, and the second expression (with two terms) provides a little more insight: the return a company earns on its capital can be thought of as (1) how much the company earns relative to how much revenue it generates and (2) how much revenue it generates versus the amount of capital it uses.
These two terms are, of course, the company’s operating margin (how much revenue can the company “keep”) and its turnover (how much and how quickly can it sell stuff).
While this insight is familiar to any student of finance, Mauboussin and Callahan bring it to life by breaking apart the universe of the largest companies according to the two metrics. They plot the top 500 companies in the Russell 3000 according to these two metrics. The chart below is from their 2023 paper, and it shows each company as a dot, according to the turnover and operating margin they produced in 2022.3
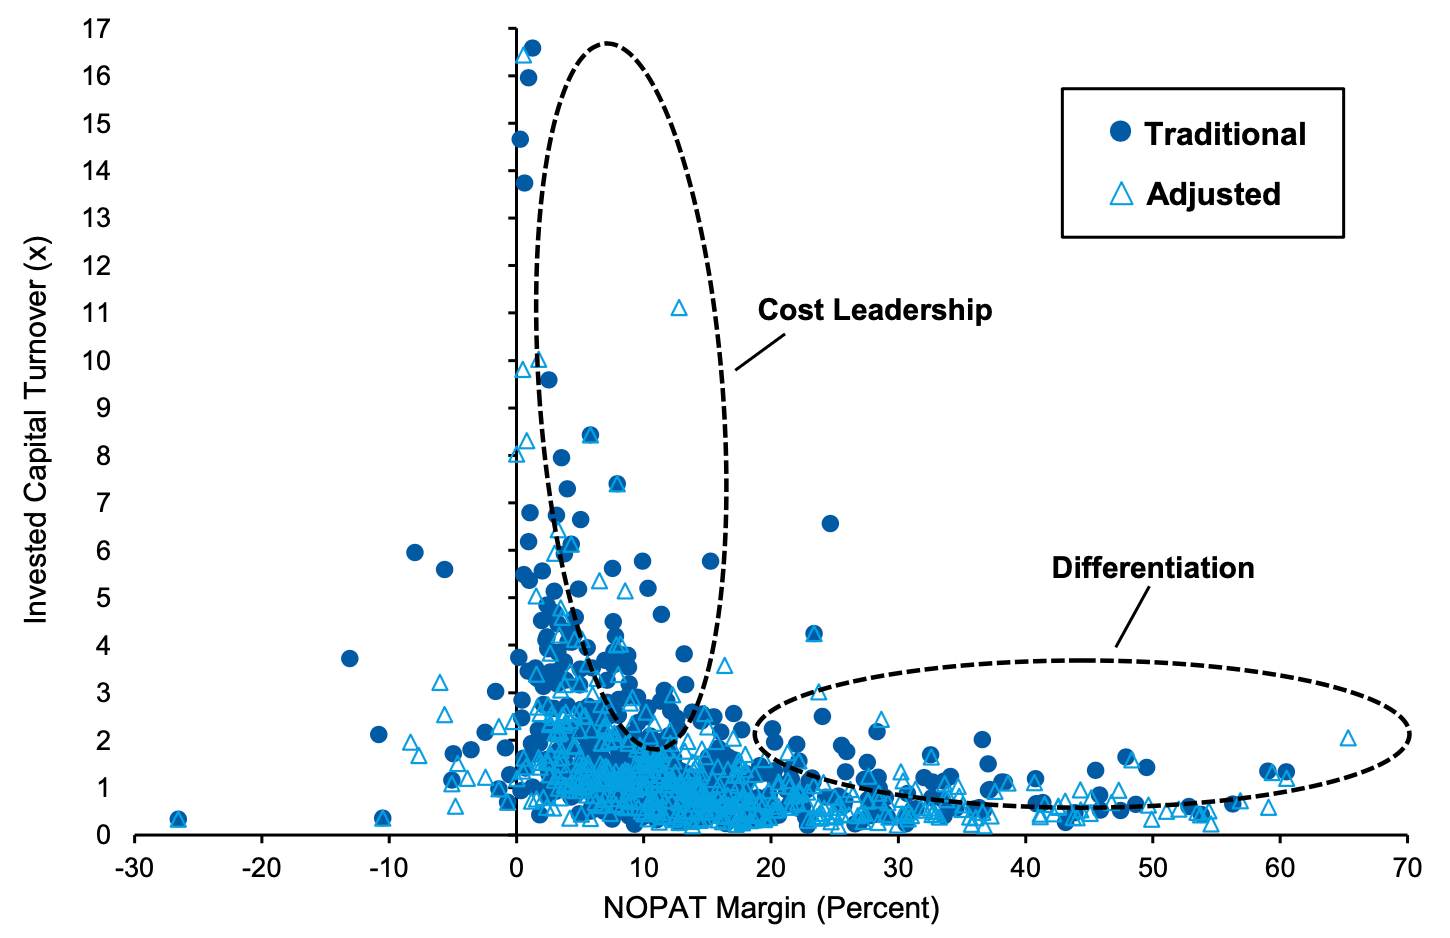
Mauboussin and Callahan then point out that there are two domains into which many companies fall to one degree or another:
High turnover and low operating margin (top of the chart) - These are companies that sell a lot of goods or services, but that don’t generate very high profits on any given sale. They make their money on volume. Mauboussin and Callahan label these companies as cost leaders. They are able to sell a lot because they have better prices than their competitors for any variety of reasons. I would also add that these are companies that have great distribution; they sell a lot because they make it easy for the customer to obtain their goods.
Low turnover and high operating margin (bottom right) - These companies sell comparatively less, but on each sale, they generate very large profits. They keep a large chunk of the revenue from each sale. How might a company do this? By differentiating. If a company makes something that you want or need, but you can’t get it anywhere else, then that company can charge you a lot more for the good or service than it costs them to ultimately produce it.
Updating the chart for today
The first thing I thought of when I saw the chart was “I wonder which companies fall into each domain.” Mauboussin and Callahan address this briefly, and I immediately wanted more.
I set out using Bloomberg to create an update of the chart above. By doing so, I could check out each company for myself.
Also, instead of charting only the top 500 companies, it would be nice to expand the universe a bit and see if there are smaller companies that stand out as cost leaders or differentiators.
The updated chart is below. It shows 1,769 companies based on their invested capital turnover and operating margin over the latest trailing twelve months.4
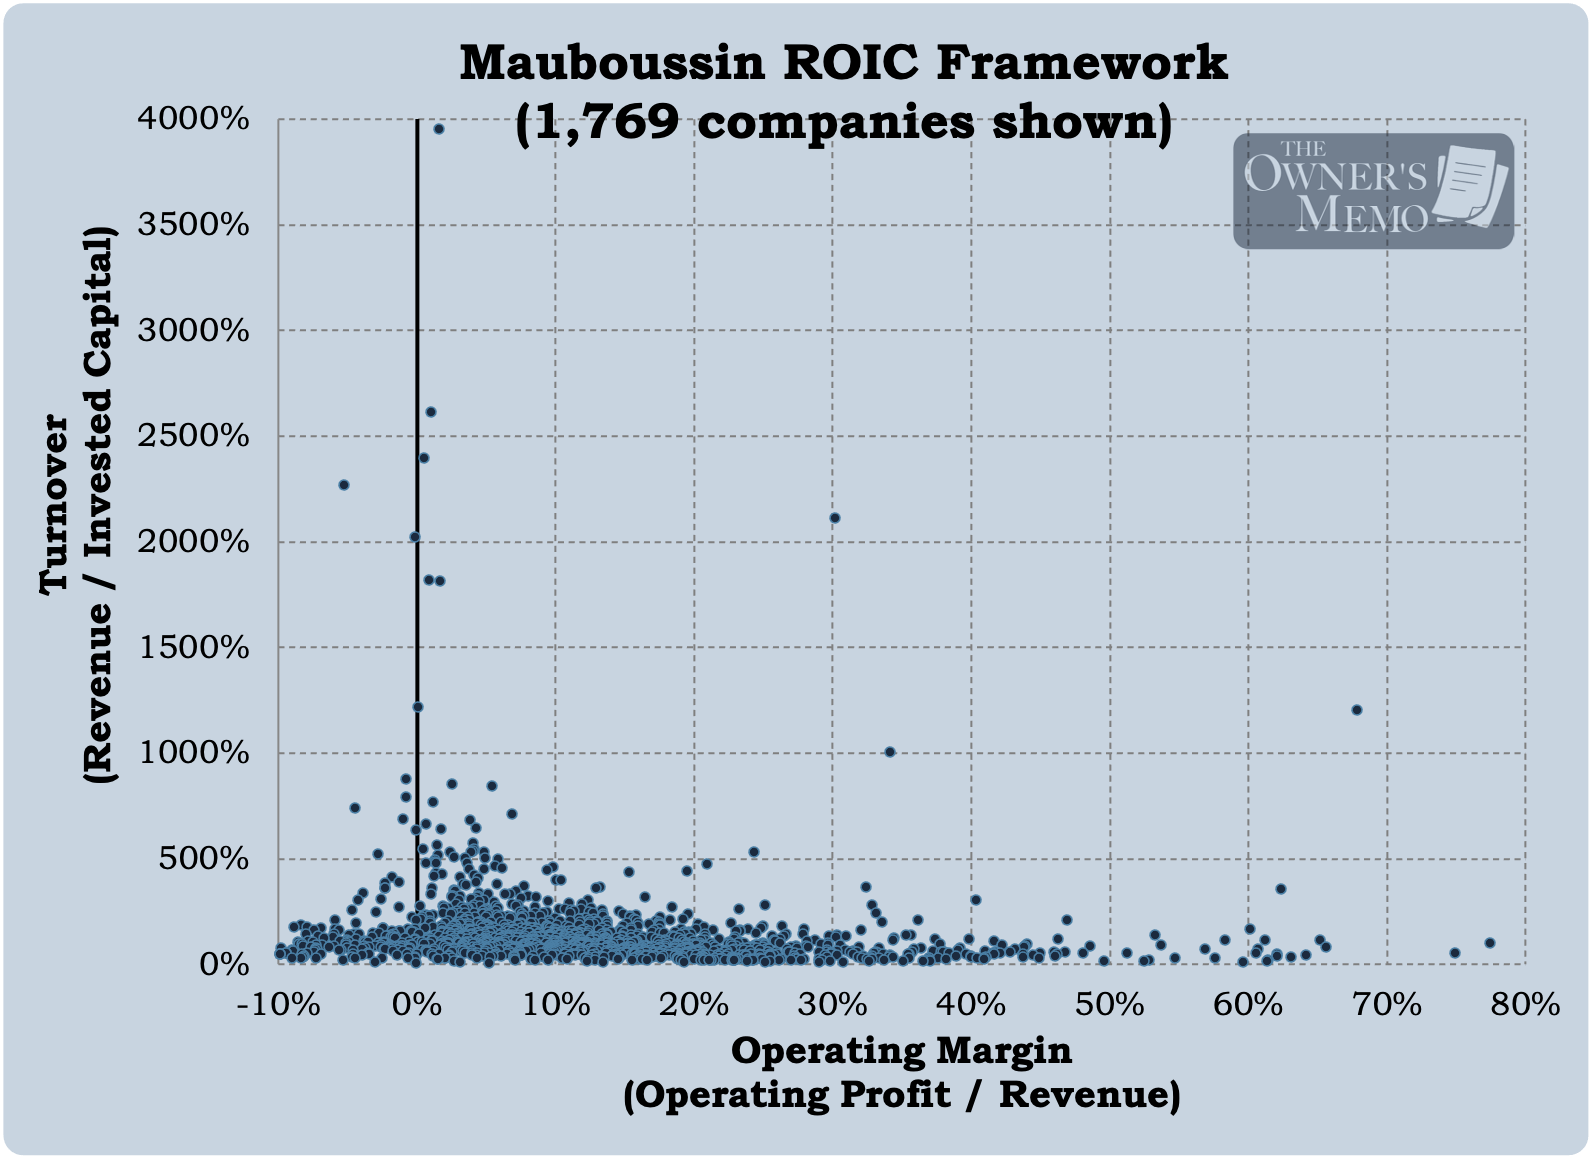
The pattern in the updated chart is similar to Mauboussin and Callahan’s, although ours is much more exaggerated. Whereas the company with the highest invested capital turnover on Mauboussin’s chart has a value of 1,600%, because we included more companies than the top 500, there are several outliers above that level on our chart.
The figure below identifies those companies.
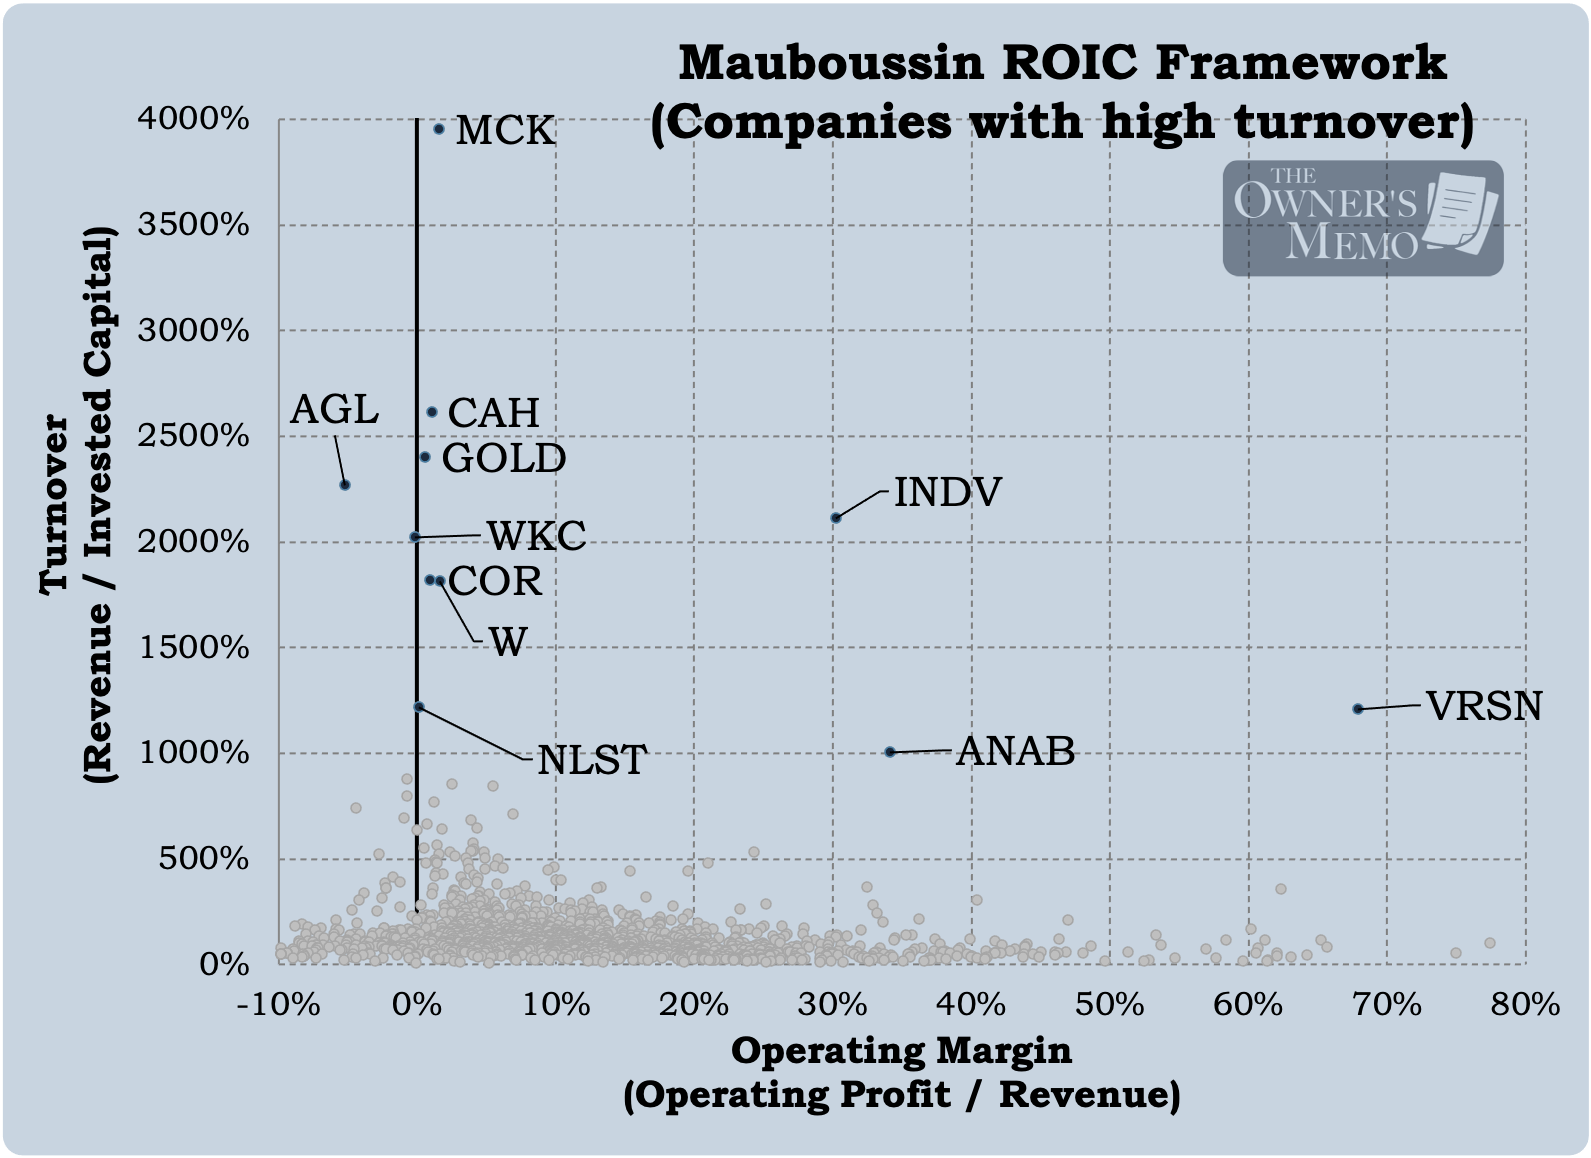
And the table below identifies each company by name.
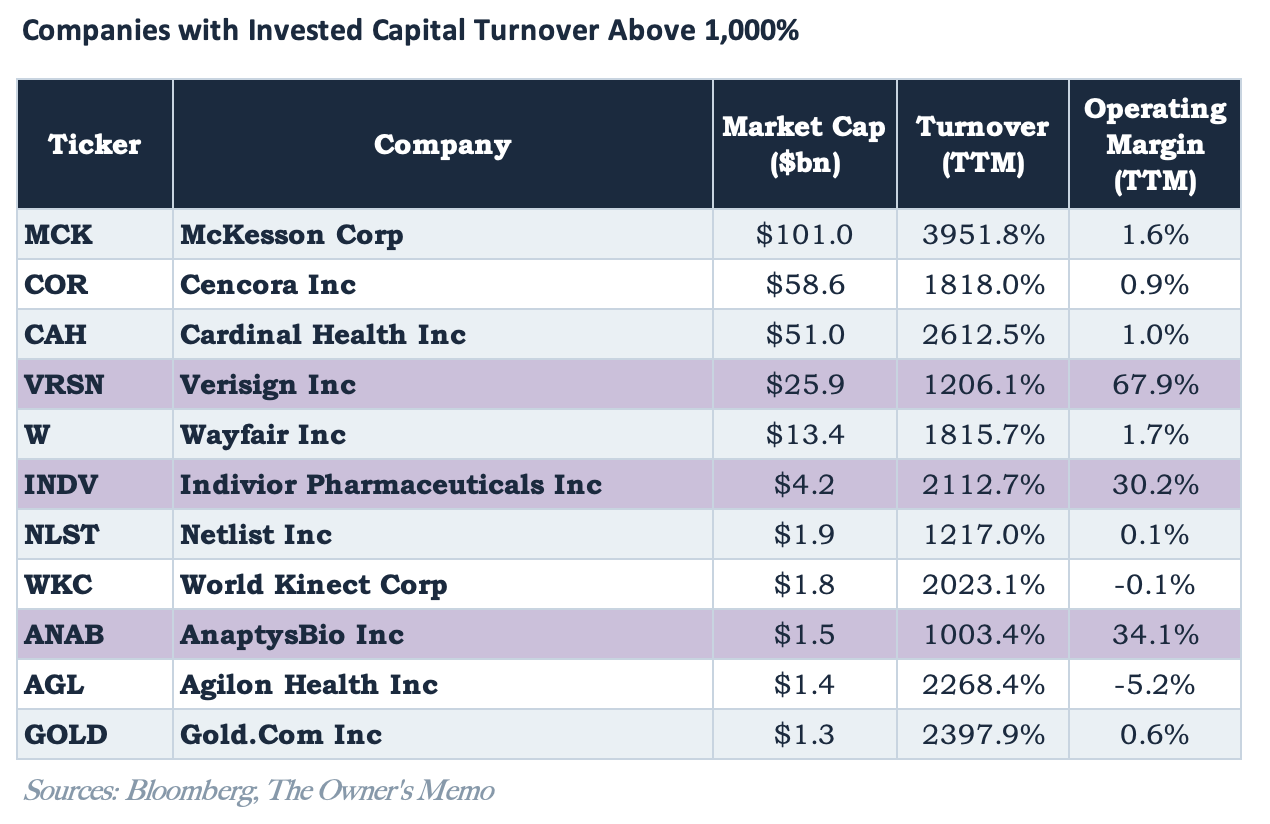
A company’s presence on this list does not necessarily imply it is a great company, of course. Most of the companies simply feature very high rates of turnover, that is, they sell a lot of stuff relative to the capital invested in their businesses. But their operating margins are low, which implies that their returns on invested capital are not incredibly high.
Also, the list tells us nothing about each company’s valuation in the market, which is critically important in considering any of these as investments, obviously.
There are three companies, however, that have high operating margins in addition to their high rates of turnover. I’ve listed them below, along with each company’s estimated forward P/E ratio for next year, obtained from Bloomberg.
Verisign (VRSN) - Forward P/E of 25.9x
Indivior Pharmaceuticals (INDV) - Forward P/E of 7.7x
AnaptysBio (ANAB) - Forward P/E of 11.0x
Of the three companies, two are pharmaceuticals, and the remaining one, Verisign, is a company that provides domain name registry services and internet infrastructure. Verisign produced a very high 67.9% operating margin over the prior twelve months (a level that has been relatively consistent for many years), and the company’s revenues grew 6.0% year-over-year in the latest June 2026 quarter.
Verisign appears to be an excellent company at first glance, but, at 28.2 times next year’s forecasted earnings, it doesn’t immediately appear to be a screaming bargain.
Of the other two companies on the list, AnaptysBio is a biotech company that appears to have some pretty wild swings in revenue and net income, so I’ll set that one aside.
The other company is Indivior Pharmaceuticals.
Indivior Pharmaceuticals (Ticker: INDV)
Seeing a pharmaceutical company pop up on any screen always makes me a little angry. Maybe some of you understand. The stock may look good on the screen, but a deeper dive almost always reveals an odd one-time surge in revenue or income, a data error, or most often, a research company that is outside my circle of competence.
Indivior seems different. It has been doing business for over 25 years, initially as part of another company, and it specializes in the development, manufacture, and sale of prescription drugs for the treatment of opioid-use disorder. Its core product is called SUBLOCADE, which is a once-monthly injectable medication.
SUBLOCADE enjoys a leading 76% market share in the long-acting injectables category, and company revenues have been increasing as a result. Over the last twelve months, the company captured $1.3 billion in revenue, up 13.6% year-over-year.
The company has a market cap of $4.2 billion, an enterprise value of $4.5 billion, and a stock price of $35.82 as of September 25.
Management has also been focused on cost savings, which has resulted in operating margins increasing from negative levels in 2022 and 2023 to 30.2% over the last twelve months. Operating margins for 2026 Q2 came in even higher, at 46.6%. For the full-year 2026, management is forecasting a continued surge in cash flow, with their measure of adjusted EBITDA up 68% YOY to a midpoint of $720 million.
In addition, management has been repurchasing stock, which suggests they are being somewhat thoughtful of shareholders in their use of capital. In 2026 Q2, they repurchased 4.7 million shares, or 3.8% of shares outstanding.
Now, pharmaceutical companies are almost always outside my circle of competence, and Indivior and its products are too. But while a major part of the story here lies around SUBLOCADE retaining its market share and growing its market, another chunk lies around financial practice, like cost savings and share repurchases, which are more familiar topics. The investment thesis here does not center around a breakthrough moonshot treatment.
More than that, I noticed another major development when doing this first bit of research on the company. Indivior has agreed to a merger with another company, Supernus Pharmaceuticals, which is still subject to shareholder and regulatory approval. Here is the announcement from August 3:
Supernus Pharmaceuticals, Inc. (Nasdaq: SUPN) and Indivior Pharmaceuticals, Inc. (Nasdaq: INDV) today announced that they have entered into a definitive agreement to combine in a tax-free all-stock merger of equals transaction to create a leading diversified, central nervous system (CNS) biopharmaceutical company with significant scale. The transaction is expected to generate significant value for stockholders of both companies, realizing $125 million in expected annual cost synergies.
Supernus is a company focused on the development of products for central nervous system diseases, and it is not consistently profitable. Its revenue increased by 32.4% YOY in the most recent quarter, and it has a robust pipeline of potential new treatments, which is part of Indivior’s motivation to merge. It has a market cap of $2.5 billion, an enterprise value of $2.2 billion, and a stock price of $42.69 as of September 25.
Great, another pharma company to figure out. Thanks Tim.
Hold on a second. What caught my eye about the merger was the cost savings that management intends to pull out of the combined companies: $125 million in expense savings. With Indivior forecasting adjusted EBITDA of $720 million and Supernus sporting the opposite, a trailing-twelve-month EBITDA of -$28.8 million, those cost savings mean that the combined company should have a rough (adjusted) EBITDA around $816 million. (Indeed, in the merger announcement, the company projects a pro forma adjusted EBITDA of $888 million.)
In addition, Indivior plans to pay a special dividend to its shareholders of $1 billion prior to the closing of the merger, financed in part by a $650 million term loan. If the merger takes place, pre-merger Indivior investors will receive a dividend of $8.47 per share and will own a combined company with an implied enterprise value of about $6.7 billion on $816 million of EBITDA.
The combined company will be named Supernus, Inc. Indivior holders will have about 56.5% of the combined company, and closing is anticipated to be in Q4 of 2026.
Obviously, a lot more work should be done on the business of both companies, but the situation is certainly interesting.
An idea that started as a profitable and somewhat mature pharma name also looks like a potential Joel-Greenblatt-type special situations investment.
Examining the outliers proved to be a valuable piece of work. In Part 2, we’ll dig deeper into the largest companies in the world and to even smaller companies on the frontier, where the highest-ROIC businesses sit, and discuss another potentially undervalued company.
Disclaimer
The Owner’s Memo is published for informational and educational purposes only. Nothing here is investment, legal, or tax advice, or a recommendation to buy or sell any security. The content is general and does not consider your individual circumstances, objectives, or risk tolerance. I am not a registered investment adviser or broker-dealer.
I may own positions in securities I write about, and I disclose any position at the time of publication. My views may change without notice, and I have no obligation to update prior posts.
Investing involves risk, including loss of principal. Past performance is not indicative of future results. The information here comes from sources I believe to be reliable, but I make no guarantee of its accuracy or completeness. Do your own research and consult a qualified professional before making investment decisions.
“A Lesson on Elementary, Worldly Wisdom as It Relates to Investment Management and Business”, Charlie Munger, Speech given at the University of Southern California Marshall School of Business, April 14, 1994.
There are caveats to this, which an astute reader will notice. Munger deliberately states that the returns to the stock are capped at the returns to the business, acknowledging, without saying it, that the company must be able to redeploy its profits. If it distributes some of its profits as a dividend or a stock repurchase, then the returns to the stock will depend more heavily on the price at which the investor purchased the stock and how the market values those distributions over time. The returns to the stock will also depend on how the market assesses the company’s ability to continue earning high returns in the future, regardless of the high returns it may be earning today.
Mauboussin and Callahan are deliberate and exacting in their work, and they take the time to adjust each company’s metrics, capitalizing intangible investments that get expensed, which is why their chart actually shows twopoints for each company (a dot and a triangle).
I used Bloomberg to screen for US companies that had a market capitalization over $500 million, excluding the financial and real estate sectors as Mauboussin did. After that, I further eliminated companies that had no revenue (or were missing revenue or operating income data) over the trailing twelve months, like many small pharmaceutical companies.
Although Mauboussin adjusts his operating margin measure for the company’s corporate tax rate, I did not do so. Using either method should result in the broad trends being the same, and I wanted to avoid having to make assumptions around companies with abnormally high or low tax rates for the last twelve months.
420 of the 1,769 companies had negative operating income (and hence a negative operating margin) over the TTM.