


Recently, I was reading about the investing philosophy of Jeremy Raper at Raper Capital, and I was struck by the description of his investing framework, which is similar to the way I approach much of my equity investing. As I’ve highlighted below, Raper describes how he first seeks to identify companies that can generate sustainable free cash flow.

Notice Raper mentions free cash flow and not earnings, which reflects his belief and mine that any good investor must rely on their own work, beyond simple reported figures, in order to commit cash to an investment.
Raper’s approach of looking for sustainable free cash flow bears some similarity to the notion of “owner earnings,” famously discussed by Buffett many times over the years. The concept calls for a discerning investor to look beyond a company’s reported earnings figures to understand how much of those earnings a company can actually keep and use.
Here is Buffett in his 1986 letter to Berkshire Hathaway shareholders, describing the concept using the company Scott Fetzer, which he labels “Company N”:
If we think through these questions, we can gain some insights about what may be called “owner earnings.” These represent (a) reported earnings plus (b) depreciation, depletion, amortization, and certain other non-cash charges such as Company N’s items (1) and (4) less (c) the average annual amount of capitalized expenditures for plant and equipment, etc. that the business requires to fully maintain its long-term competitive position and its unit volume. (If the business requires additional working capital to maintain its competitive position and unit volume, the increment also should be included in (c). …)
Reading Raper’s work and recalling Buffett’s “owner earnings” concept reminded me of some work I did recently finding a company that appeared cheap on the basis of the cash it generated.
Finding a cheap cash-generating company
Earlier this year, while scouring many different sources for investment ideas, I came across a company and stock that appeared to be very cheap relative to the amount of cash it was generating and, as I will discuss, to its owner earnings.
I discovered it while reading Value Line. The classic publication is still being published today, and, although some may deride it as older or less modern, I still find it an incredibly productive way to rip through a bunch of companies and potential investment ideas while avoiding the distractions that come from otherwise working online. Some of the lists produced in the publication are a great source for ideas, and the Value Line tear sheets are a nice way to get quickly acquainted with a company.
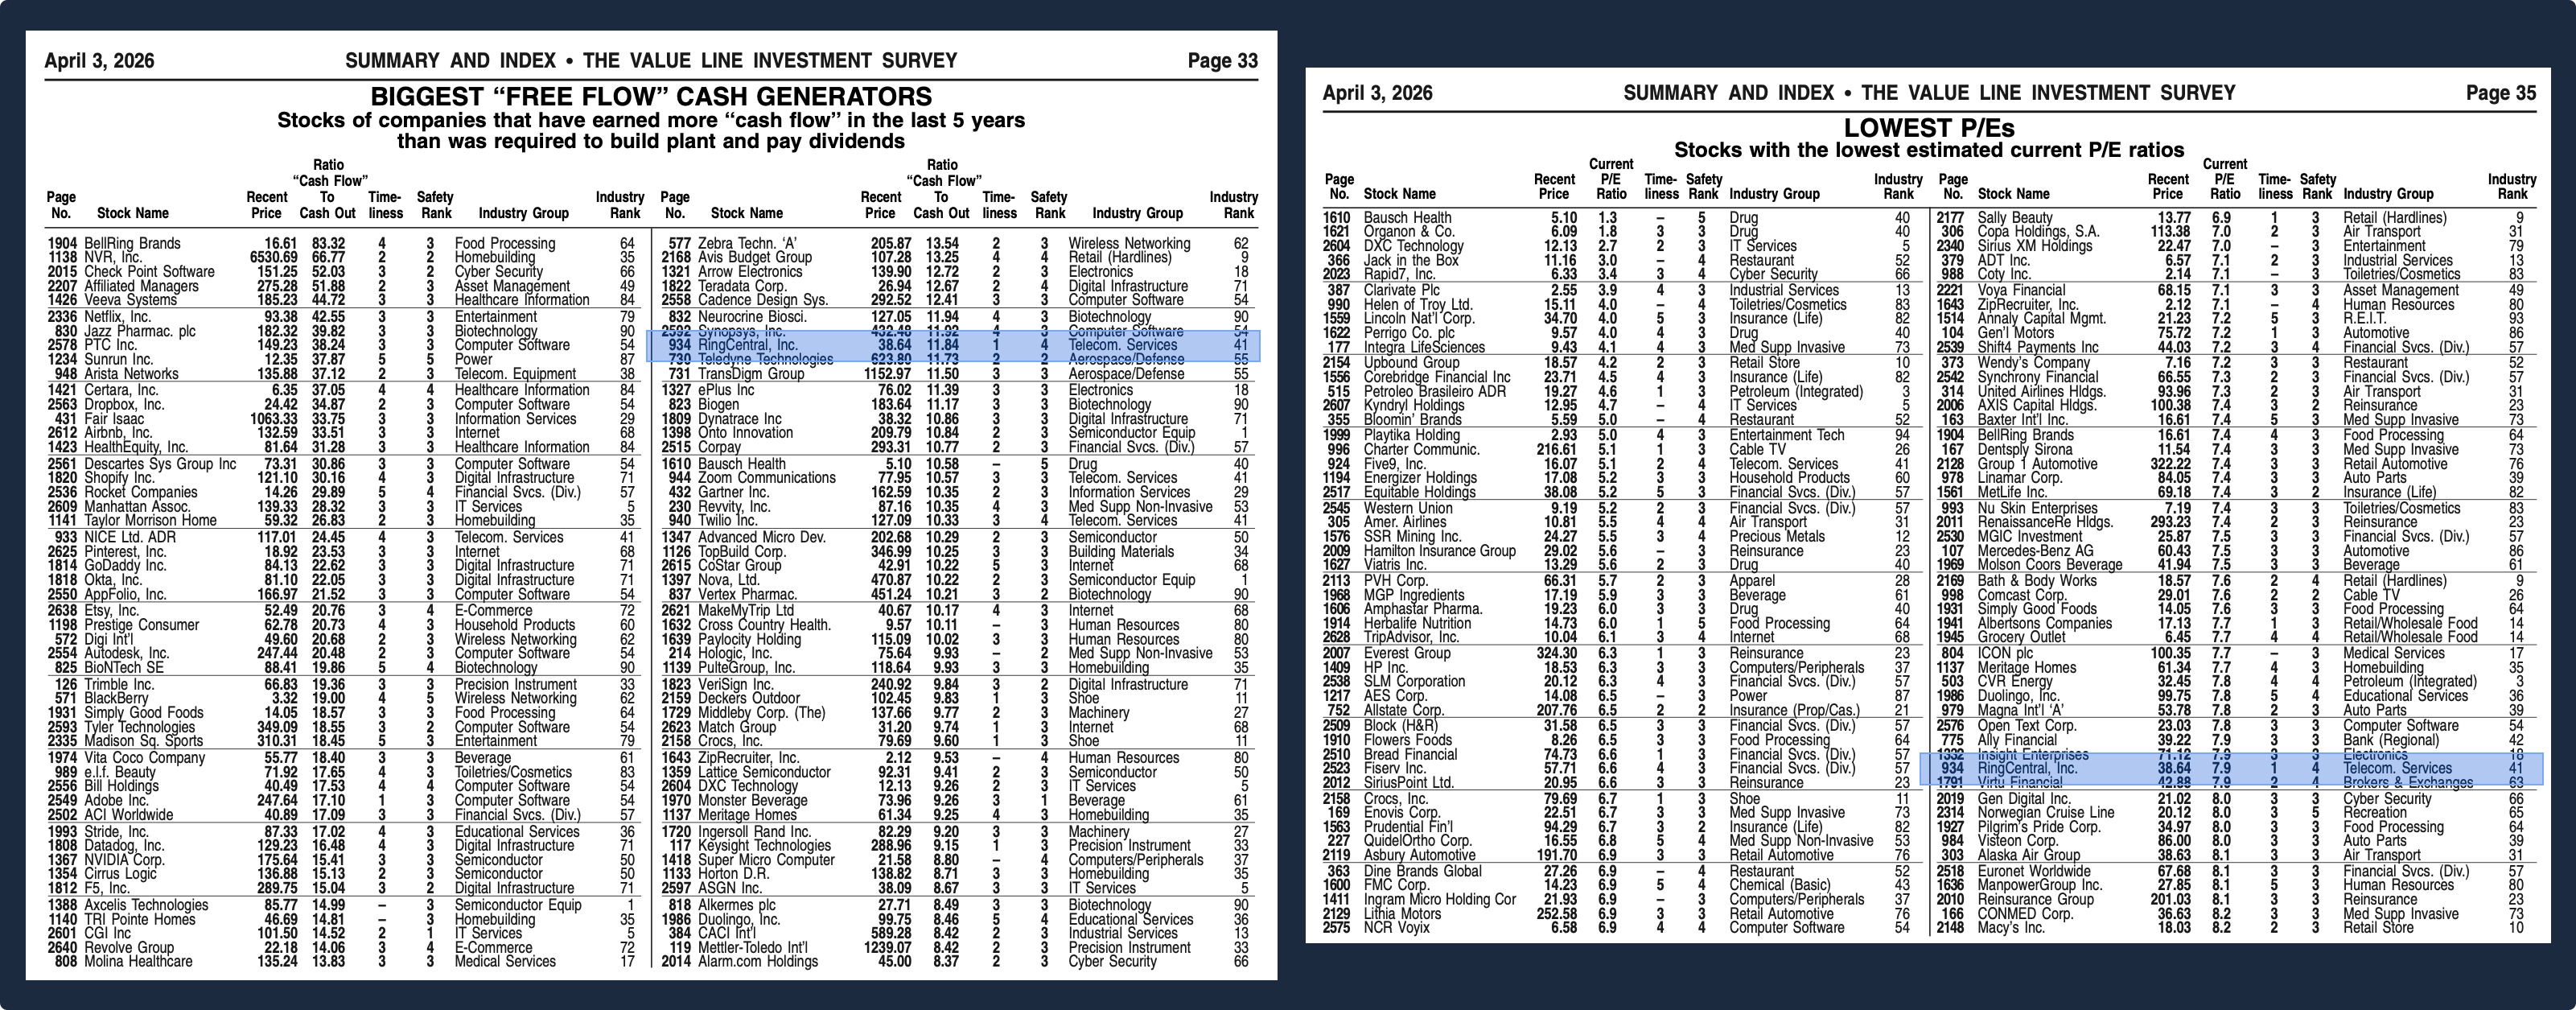
Back in the month of April, I was browsing Value Line’s lists of attractive stocks, and I noticed one company appeared on two lists, both as a “Biggest ‘Free Flow’ Cash Generator” and among those stocks with the “Lowest P/Es”. That company was RingCentral (ticker RNG).
I’ve reproduced both of those lists below, highlighting RingCentral’s place on each list.
RingCentral (ticker: RNG)
RingCentral provides Unified Communications as a Service (UCaaS), which delivers modern, cloud-based video calling, telephone, and messaging capabilities to businesses. It has been in business since 1999, and it competes primarily with Microsoft Teams and Zoom. Competition in the UCaaS space has become much more intense over the past several years, and RingCentral has developed a reputation as less than cutting-edge. Its offerings also tend to be more expensive than competitors’, which calls into question the sustainability of its revenue.
During COVID, RingCentral’s stock price, along with that of other tech companies that were benefitting from the work-from-home trend, including Zoom, surged. Afterward, however, and partly for the reasons mentioned above, the company’s stock price decreased dramatically.
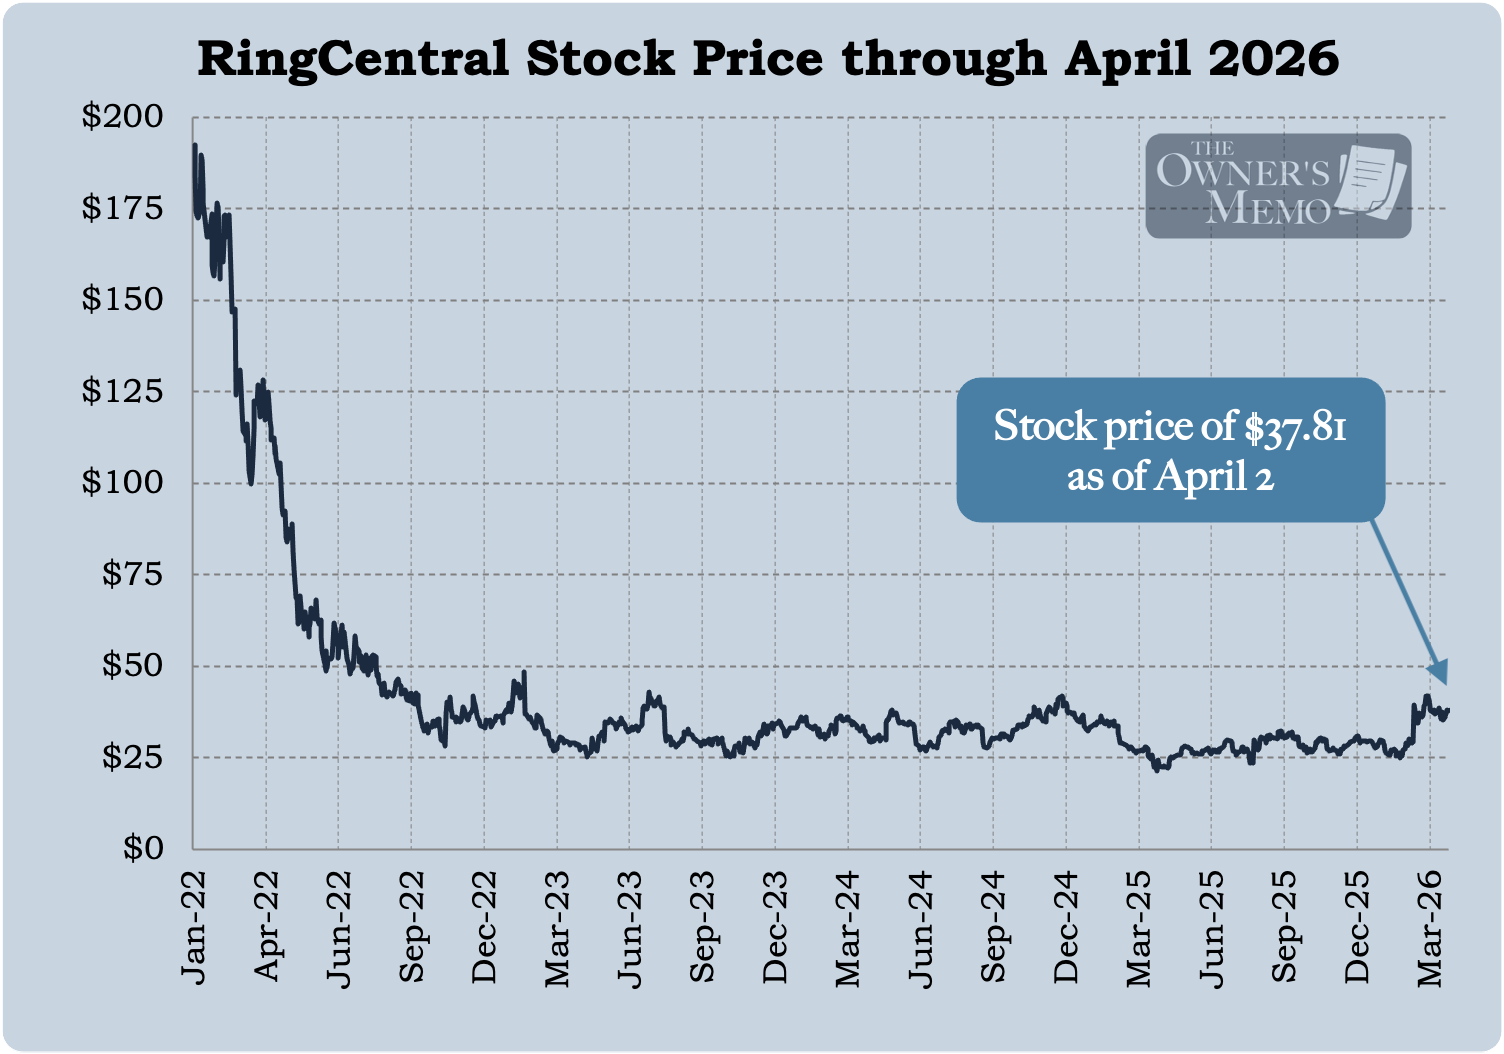
As of April 2, 2026, around the time I was investigating the company, its stock was trading at a price of $37.81 per share, representing a market cap of $3.18 billion and an enterprise value of $4.51 billion.
A quick look at the company’s financials, available through year-end 2025 at that point, showed that it had produced $43.4 million in net income for the trailing twelve months, or earnings per share of $0.52.1 Below, I’ve reproduced the company’s income statements for 2025 and the three years prior.
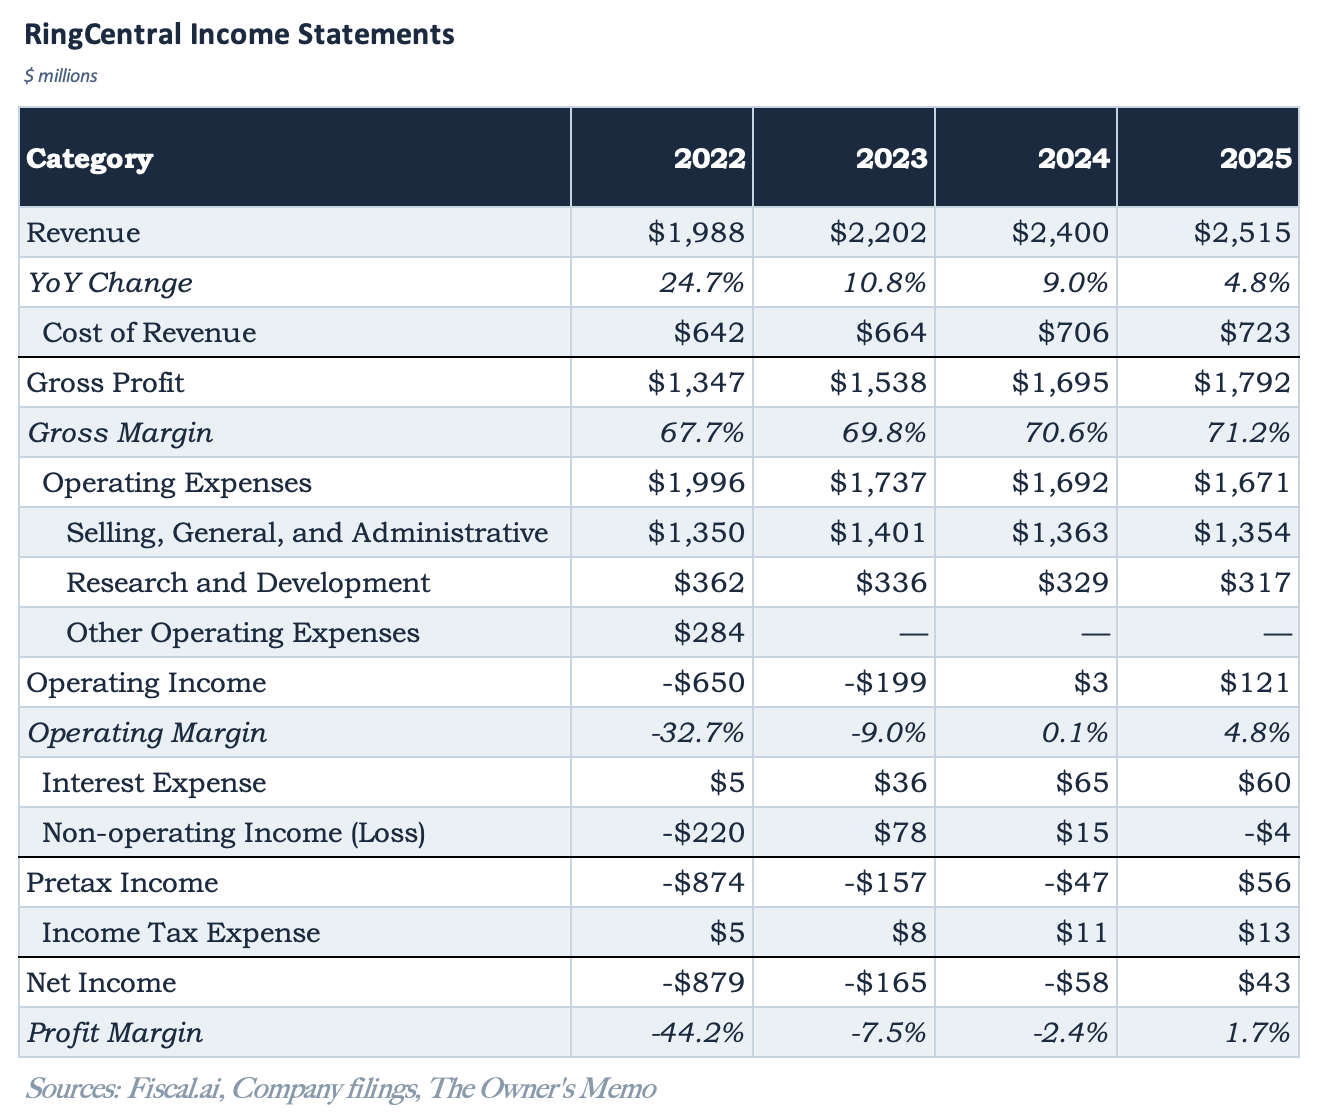
With a market cap of $3.18 billion and $43.4 million in net income for 2025, the stock was trading at a TTM P/E ratio of 73.3. Obviously, this was no indication that the company’s stock might have been cheap.
RingCentral’s cash flow statements indicated that its GAAP earnings were too low
But what about the company’s cash flow statement? Was there anything there that might indicate the company’s stock was more attractive than its recent income statements indicated? After all, the stock was on Value Line’s list of high cash generators. Below I show RingCentral’s cash flow statement from the same years.
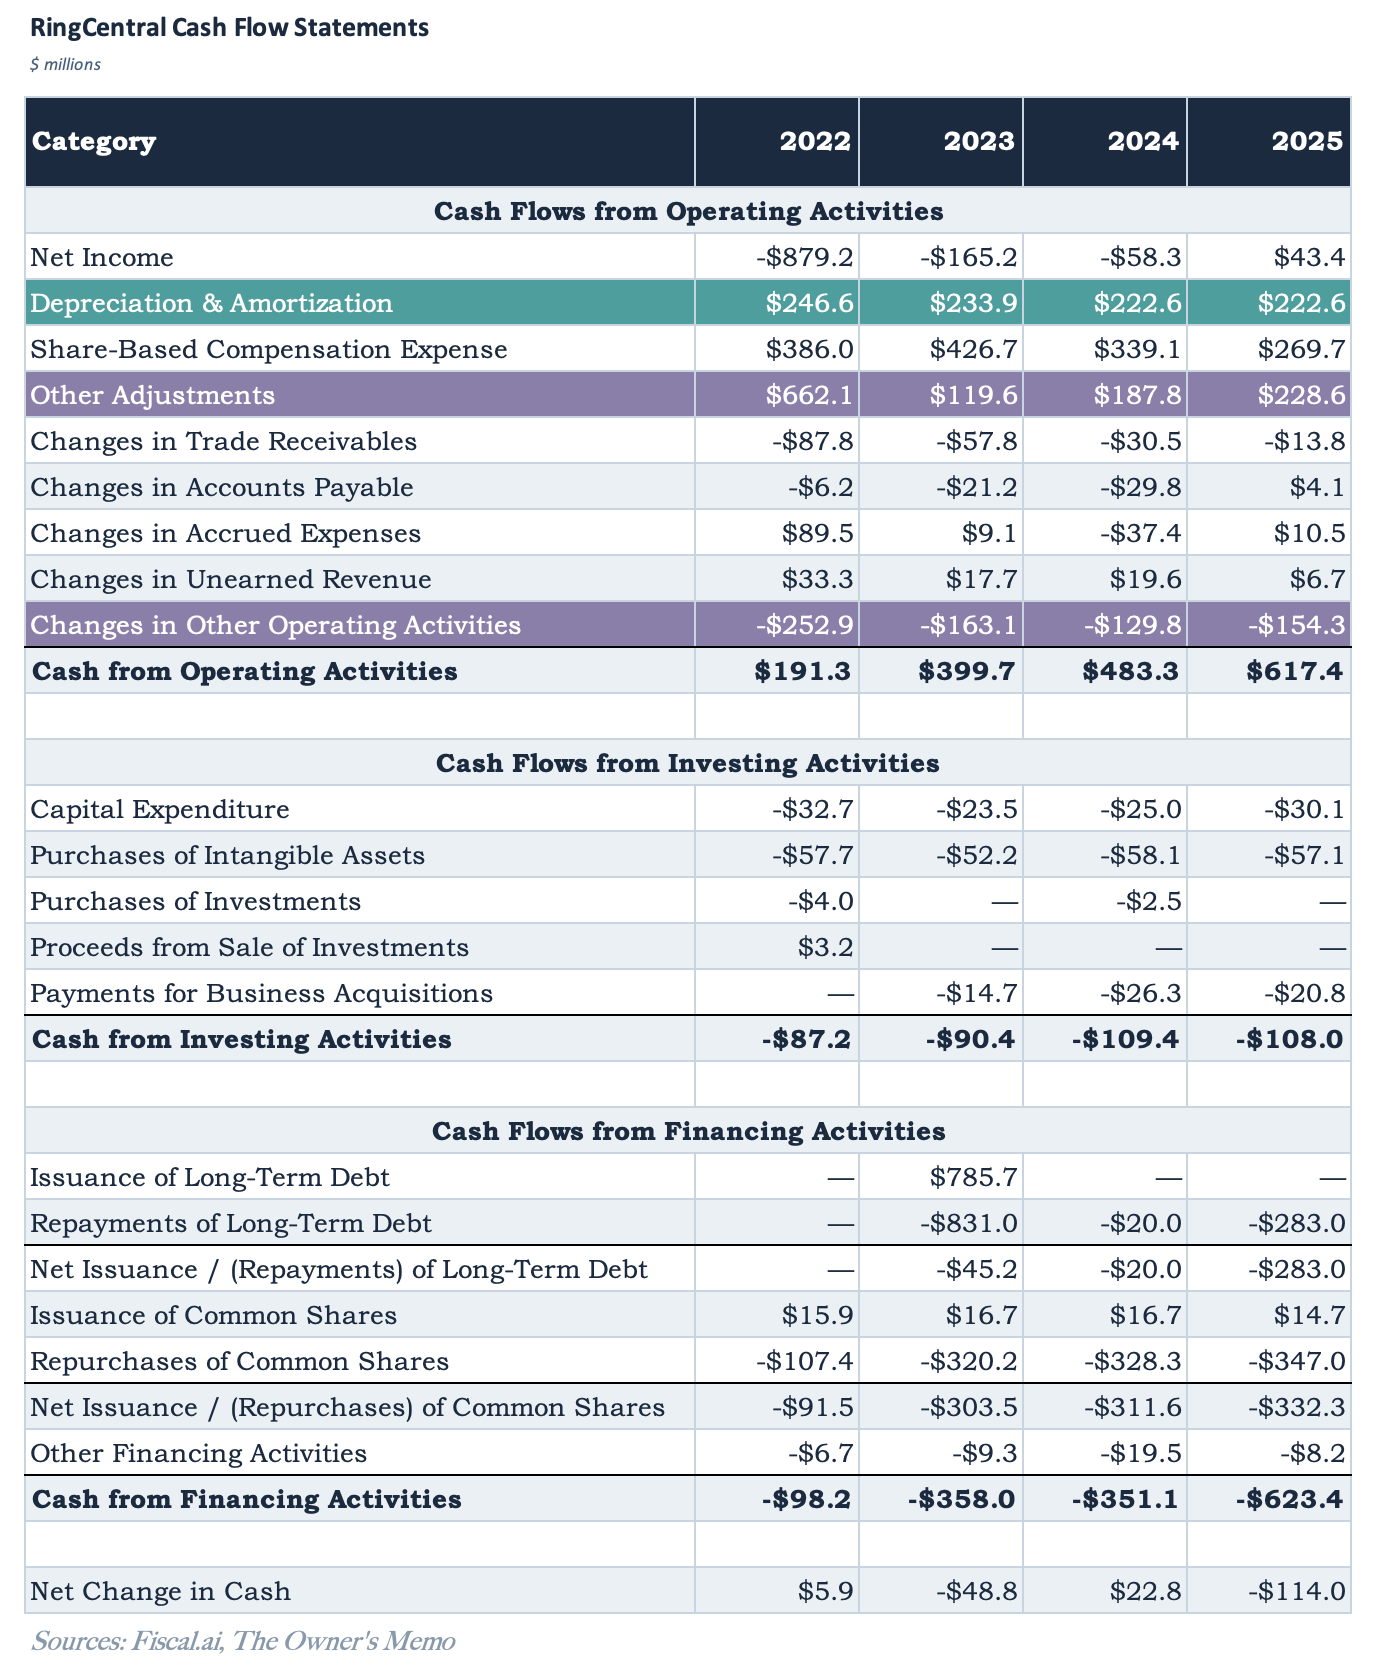
In the statements above, we see something very interesting. RingCentral produced only $43.4 million in net income for 2025, but it produced a whopping $617.4 million in cash from operations. I’ve highlighted what I think are the most interesting line items.2 Focusing on the figures for 2025:
Depreciation and amortization of $222.6 million. This represents $87.1 million of D&A for property and equipment and $135.4 million of amortization for acquired intangible assets.
“Other adjustments” of $228.6 million, offset by “Changes in Other Operating Activities” of -$154.3 million, for a net adjustment of $74.3 million. There are a number of items inside each of these, but they primarily represent two things: $163.5 million for “Amortization of deferred and prepaid sales commission costs” and an offsetting -$111.6 million for “Changes in deferred and prepaid sales commission costs” (netting to $51.9 million). Essentially, these two items represent a net cash benefit for the company related to the fact that sales commissions are paid up-front in cash, but the expense is amortized over time. Sales commissions are lower today than in the past, so this results in more current amortized expense than cash currently being paid out, which is a net cash benefit to RingCentral.
Together, these two items add $296.9 million back to net income, and both are fair adjustments to make in estimating RingCentral’s owner earnings, provided we also deduct the company’s capital expenditures. I have created such an estimate of owner earnings below, assuming that all “Cash from Investing Activities” is necessary CapEx, except “Payments for Business Acquisitions”.
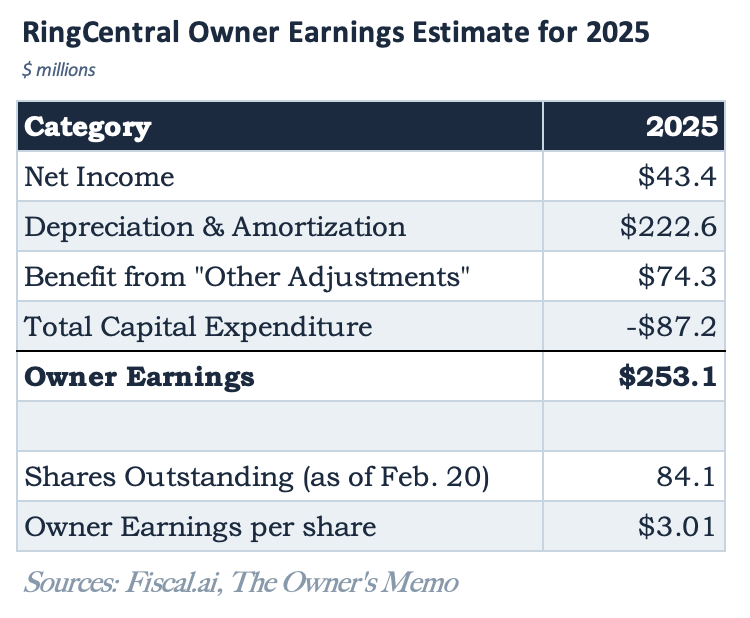
So, adjusting RingCentral’s net income to provide a better sense of owner earnings produces a more attractive stock valuation than before. With a market cap of $3.18 billion and $253.1 million of owner earnings, the result is a TTM “owner earnings” P/E ratio of 12.6.
That’s not bad, but it’s only half the story.
RingCentral was a changing business and management’s guidance for the future was very favorable
While RingCentral’s income statement was a poor indicator of how much the company was earning, it does provide a small clue about something else: the company was improving, in addition to already producing a lot of cash. Over the four years shown in Figure 4, its gross, operating, and net margins have all risen every year. And that gives us a hint as to why RingCentral, with a TTM P/E of 73.3 and an “owner earnings” P/E of 12.6, was on Value Line’s “Lowest P/E” list in the first place, with a Value Line P/E of 7.9.
The reasons for that are twofold: (1) Value Line will exclude unusual or one-time gains or charges from its earnings calculations and (2) Value Line uses twelve months of company earnings, calculated using the most recent six months of history and its estimate of the next six months.3
In other words, Value Line’s P/E ratio excludes some unusual items, similar to the way we did when we calculated owner earnings, and it also involves an estimate of the next six months of earnings. How can we get a sense for that future estimate?
In cases like this, I find it very useful to thoroughly read the company’s reports for clues. And in RingCentral’s case, the earnings presentations provided a lot of information.
RingCentral was a changing business. After years of breakneck revenue growth in its traditional UCaaS business lines, those lines were slowing (but still growing) and, according to management, the company was in the midst of transitioning the product line to being more focused on AI. Here is founder and CEO Vlad Shmunis, on the company’s 2025 Q4 earnings call on February 19, 2026:
…our pure AI ARR revenues have almost tripled year-over-year, and has contributed significantly toward us meeting our stated goal of $100 million ARR from new products in 2025.
But even more importantly, ARR from customers who utilize at least one of our monetized AI products, which we refer to as RCAI-utilizing customers, has now more than doubled year-over-year and is now approaching 10% of our overall ARR... Importantly, our RCAI-utilizing customers average significantly better ARPU and are stickier, with net retention rates exceeding 100%.
So, RingCentral was showing signs of being healthier than feared, but there were no concrete statements about the company’s profitability in the quote above. Management could simply be looking through rose-colored glasses when assessing the potential for AI to improve business. Was there anything firm that could help us more directly assess RingCentral’s profitability right now or in the near future?
On that count, the answer is yes.
In the same conference call, the RingCentral management team stressed how healthy the company’s financial picture is, emphasizing two things: (1) how focused the company is on continuing its progress to increase margins and (2) how much cash the company generates and how they intend to use the vast majority of it to repurchase shares and pay down debt.
Below is a smattering of slides showing some of those things.
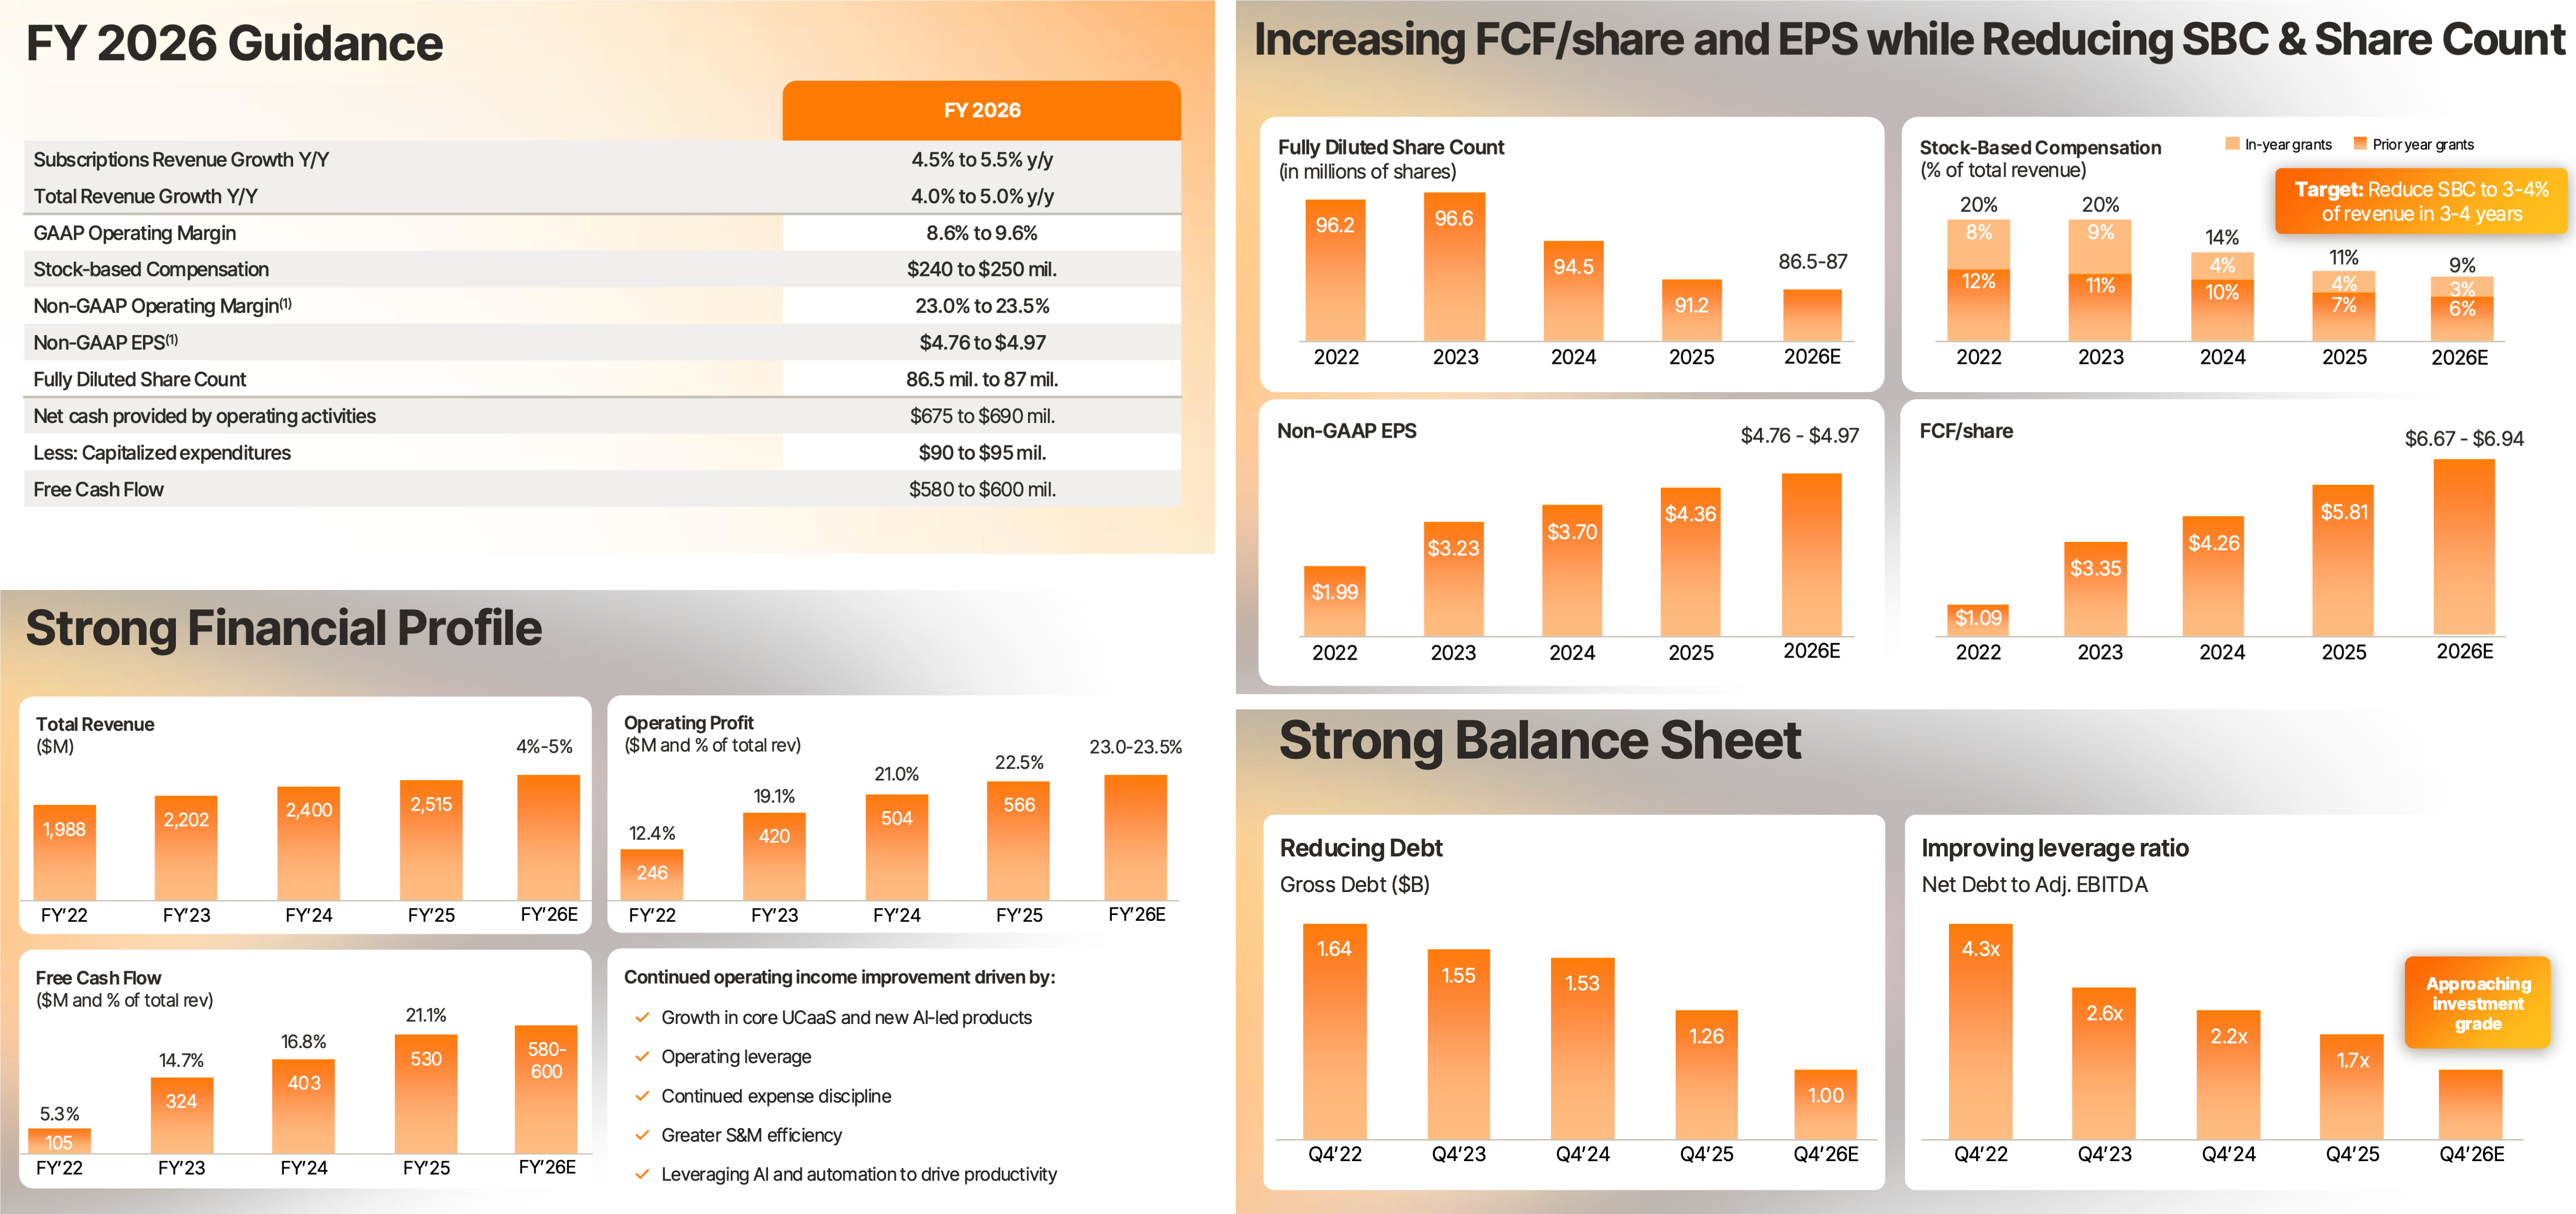
We can see from the slides (and hear on the conference call) that management had some firm financial guidance for the upcoming 2026 calendar and fiscal year:
revenue growth in the range of 4-5% (similar to 2025),
a GAAP operating margin in the range of 8.6-9.6% (up from 4.8% in 2025),
stock-based compensation of 9% of revenue (down from 11% in 2025),
long-term debt reduced to $1.00 billion (down from $1.26 billion at the end of 2025), and
total capital expenditures in the range of $90-$95 million (up from $87.2 million in 2025).
These figures should give us a good feel for how the 2026 income and cash flow statements should differ from 2025’s. But management went even further than that. On the earnings call (but not shown in the slides), they also reiterated their financial targets for the next three to four years (to be realized in 2028 or 2029):
a GAAP operating margin of 20% and
stock-based compensation of 3-4% of revenue.
Our steady-state SBC target is 3%-4% of annual revenue, as we expect to achieve it in the next three to four years…
We achieved nearly 5% GAAP operating margin in 2025, which we expect to approximately double in 2026. We are targeting to achieve approximately 20% GAAP operating margin in the next three to four years.
From those figures, we can create our own pro forma forecasts for both the year 2026 and three to four years out (from 2025) for RingCentral’s income and cash flow statements. I show that below versus the 2025 actual results.4
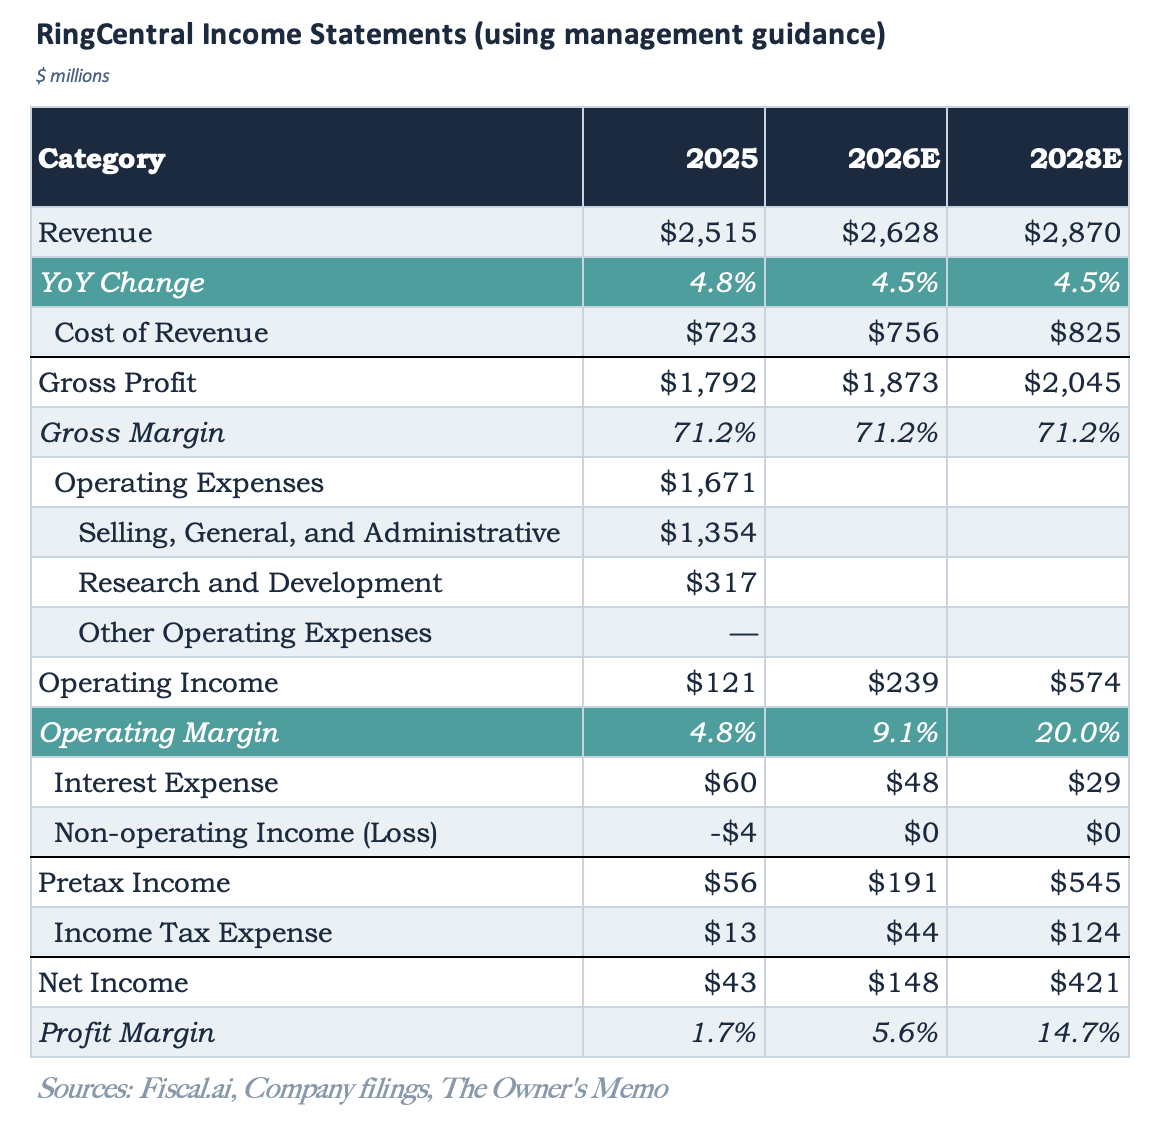
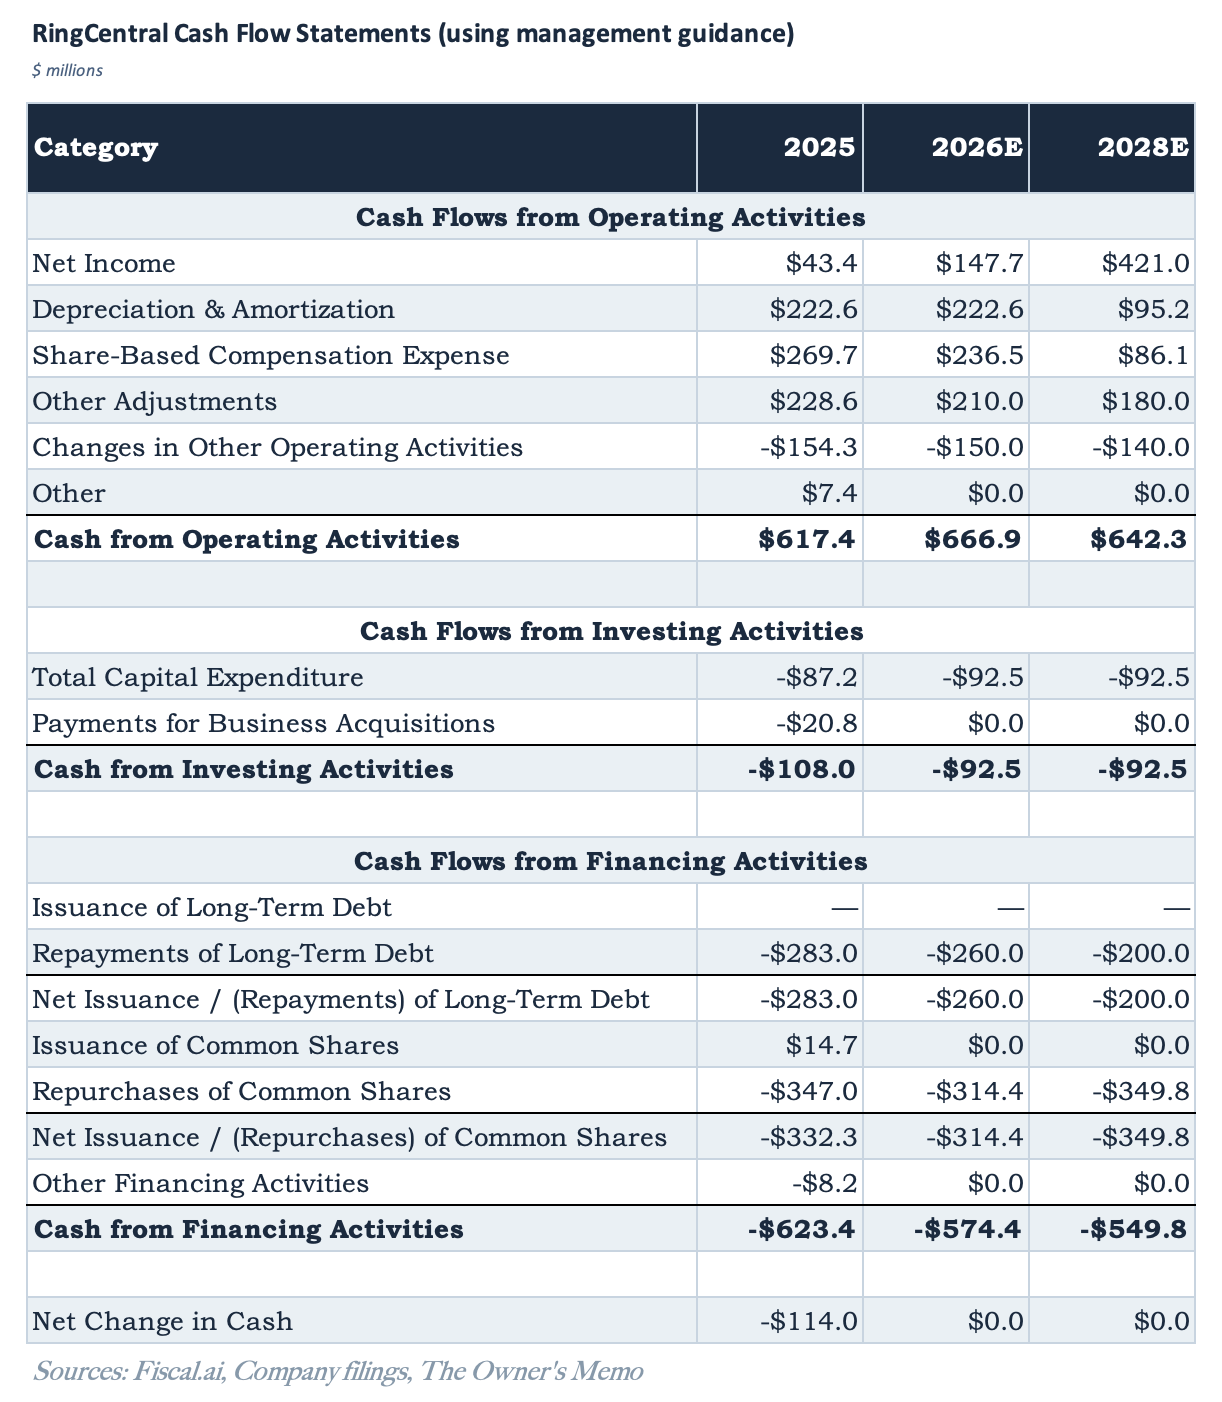
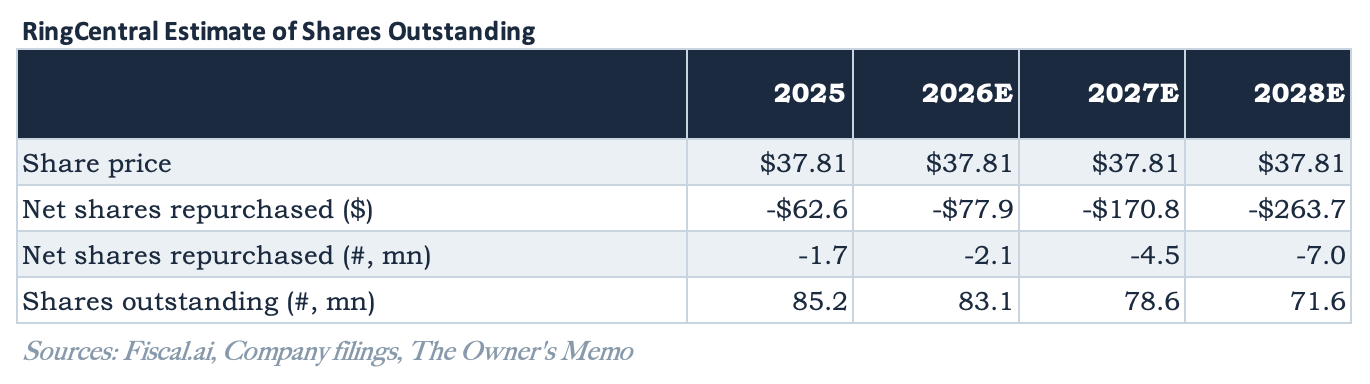
The pro forma cash flow statements show that, if management’s guidance is correct, the company should be generating similar amounts of cash in the coming years. However, because management also guided to much lower stock-based compensation, the company should be able to, on net, repurchase a lot more shares in the future.
That calculation is shown below, assuming the stock price remained at $37.81, its price from April 2.5
Now, with our pro forma cash flow statement along with our estimate for shares outstanding, we can update our estimate of owner earnings, just like we did before, only this time, we can show the estimate for 2026 and out years using the management guidance we showed above.
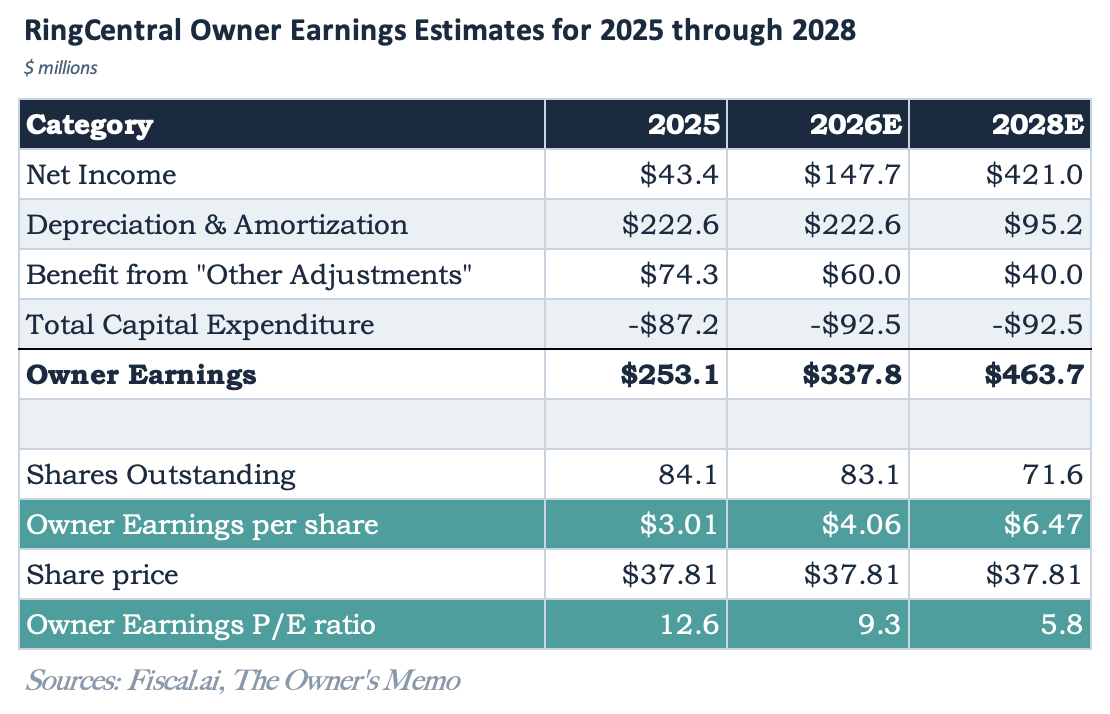
While the income statement showed a company with a TTM P/E ratio of 73.3, Figure 11 shows that the company was generating $253.1 million in owner earnings in 2025, for an owner earnings P/E ratio of 12.6, and by 2028 or 2029, if management hits its targets, the company would be generating $463.7 million in owner earnings. If the stock price remained at the April 2 value of $37.81, that implied that RingCentral was trading for a 2028/2029 estimated owner earnings P/E of 5.8 times.6
Figure 11 really drives the point home. As of April 2, knowing all we knew about RingCentral’s 2025 income statement, the stock looked anything but cheap. However, the cash flow statement told the story of a company that was generating much more cash and owner earnings than the income statement led us to believe. Furthermore, a careful reading of the company’s financial reports and earnings transcript and presentation showed a company in the midst of a transition toward much better operating results than the past.
What happened next?
In the three quarterly reports that followed from the time I was investigating RingCentral in early April, the company has made the continued progress it said it would toward its 2026 guidance figures. As of 2026 Q3, the company’s
operating margin increased to 8.0%,
annual revenue growth increased to 5.9%, and
stock-based comp expense decreased to 9.6%.
During the three quarters, the company also returned $215.3 million to shareholders in the form of stock repurchases, and it paid down $255.8 million in long-term debt. It also paid out $23.3 million in dividends. Management also raised operating margin guidance to 9.2-9.6% for the year and capex guidance to $100-105 million.
Along the way, the market finally started noticing the improvements at the company. The chart below shows what happened to RingCentral’s stock price over the course of 2026.
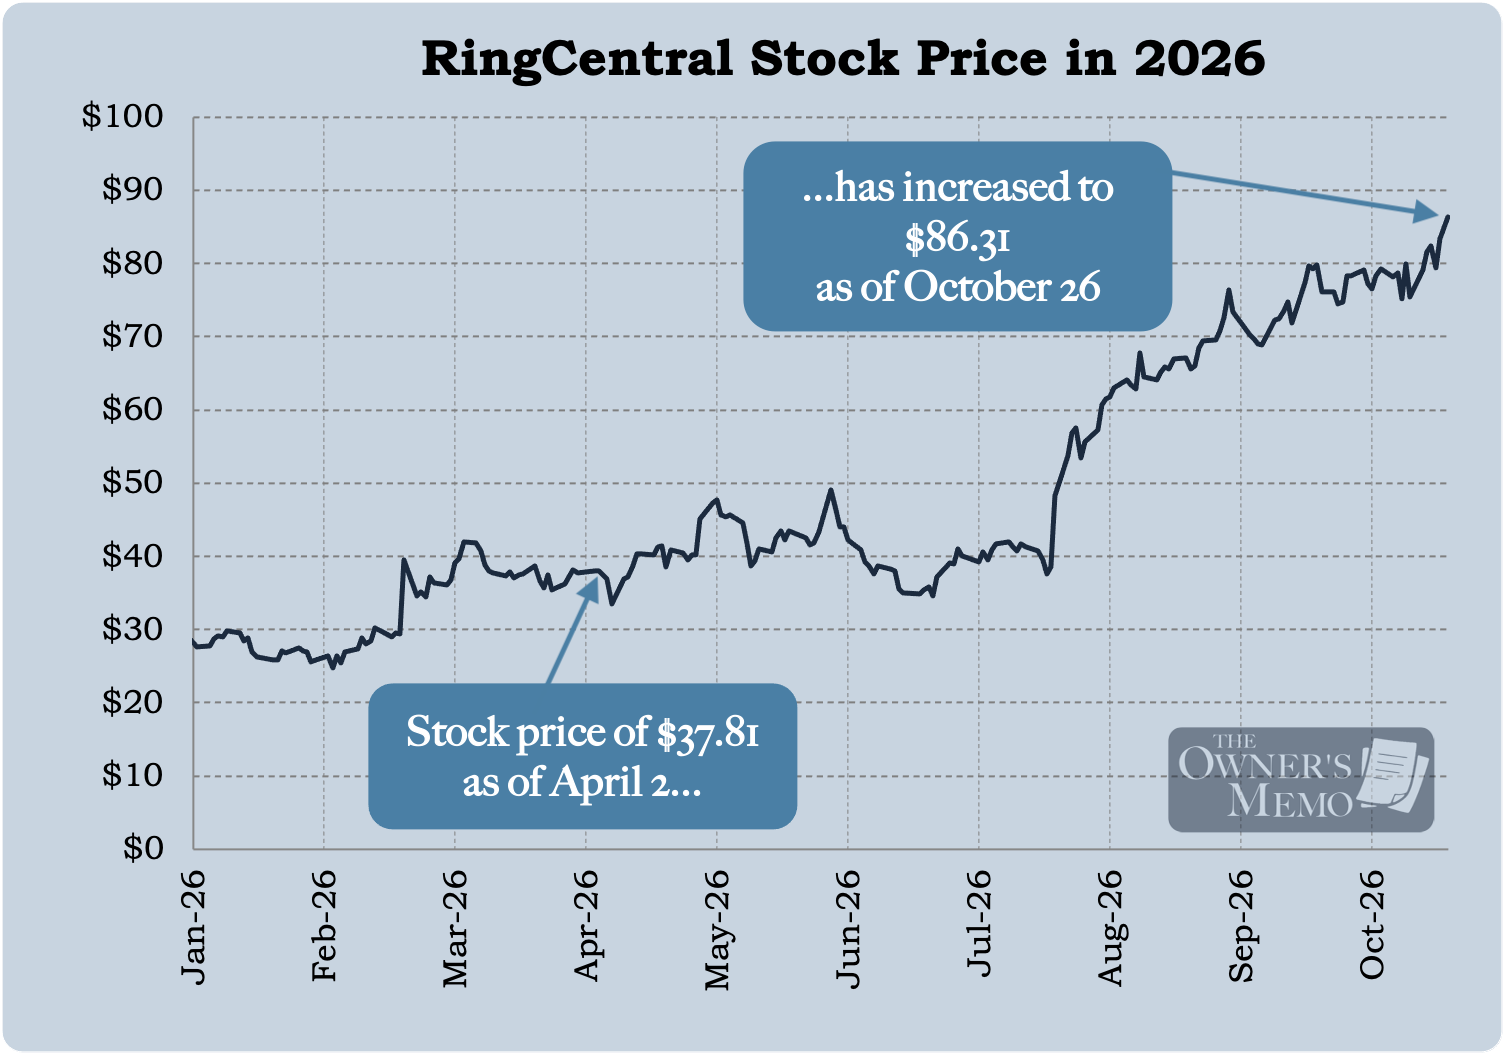
The stock increased in price from $37.81 on April 2 to a recent price of $86.31 on October 26. Including the $0.30 per share in dividends the company paid, that equates to a total return of 129% over 6 1/2 months.
The company’s Q2 earnings report on July 23 was a catalyst, which you can see in the stock chart, but, as I’ve tried to show, I believe the seeds of change were visible even before that.
Next week, we will continue this work, exploring the current market for companies like RingCentral that generate more in owner earnings than the market may appreciate at the moment.
For the EPS calculation, I use 84,072,571 shares outstanding, the most recent share count as of the 2025 10-K report.
I’ve excluded the very large benefit to cash from stock-based compensation in my highlights. While the charge results in a large cash benefit to the company, the issuance of stock will also result in dilution to existing shareholders, so we will not treat it as a benefit (just as Buffett does by excluding it as a benefit in his definition of owner earnings). Note for later, however, that the stock-based comp expense has been decreasing pretty dramatically from 2023 through 2025.
See the Value Line methodology for more.
As of the February 2026 earnings call referencing 2025 results, RingCentral’s management team gave “three to four years” targets, which implies they expect them to be realized in 2028 or 2029. I label my pro forma calculations “2028E” for simplicity.
The net income figure in the cash flow statement is driven by the net income figure in the income statement, which is, in turn, driven by management’s guidance.
The “Total Capital Expenditure” figure in my cash flow statement is the combination of the company’s line items (via Fiscal.ai) of “Capital Expenditure” and “Purchases of Intangible Assets,” the latter of which represents capitalized internal-use software.
In my calculation of shares outstanding over time, I am netting the dollar amount of shares repurchased versus the dollar amount of stock-based compensation. Technically, I should be using the dollar amount of shares actually issued which can differ from the period’s stock-based compensation expense due to the schedule of vesting. For the purposes of the article, I am simplifying because all the gymnastics wouldn’t change the conclusion.
Note too that our 2026 owner earnings P/E estimate is 9.3 times. Recall that Value Line’s P/E estimate was 7.9 times.
This was a fun read. I think the concept of ‘owner earnings’ is super important and I am surprised how little it gets spoken about today. I always adjusted stated earnings to find the underlying cash generation power. When I bought 5% of Adidas, Wall Street was focused on stated earnings which had a number of 1x items that were depressing the number. But the company also had these big non-cash depreciation and amortization charges from past spending and capex was artificially high as they were finishing a HQ remodel. Once I adjusted for those items, we were paying less than 10x for earnings that we thought would grow high singles in the worst case for the next 3-5 years. I am excited to look at Ring more closely.