


How high of a return should I be shooting for as an equity investor? What level constitutes a great return? These are questions I’ve thought about a lot. Every so often, I read something about some of the all-time great investment records.
The best investing records
Below are some of those examples. For sources, see footnotes1.
Warren Buffett: From 1957 to 1968, he produced annualized returns of 31.6% for his partnership.
Charlie Munger: From 1962 to 1975, 19.8% annualized for his partnership.
Walter Schloss: From 1956 to 1984, for 28 years, 21.3% per year.
Ted Weschler: From 1989 to 2012, he turned $70,385 into $131 million in his IRA account, equivalent to about 39% per year.
Joel Greenblatt: From 1985 to 1994, a stunning 50% per year.
George Soros: From 1969 through 1994, the Quantum Fund produced 35% annualized returns.
Stan Druckenmiller: Returned 31% per year over 30 years. I believe this record overlaps with Soros’s above.
Jim Simons: From 1988 to 2018, Renaissance Technologies’ Medallion Fund generated an incredible 66.1% average gross annual return.
Peter Lynch: From 1977 to 1990, for the Fidelity Magellan Fund, he produced a 28.9% annualized return. The fund grew from $18 million to $14 billion.
Bill Ruane: From 1970 to 1984, the Sequoia Fund generated 17.2% annualized returns for investors. (Bill also produced 14.7% annualized returns from 1970 to 2015, a 45-year record.)
Tom Knapp: From 1968 to 1983, for Tweedy, Browne Partners, 20.0% annualized returns.
Lou Simpson: From 1980 to 2004, 20.3% per year for the GEICO equity portfolio.
Nick Sleep and Qais Zakaria: From 2001 to 2014, the Nomad Investment Partnership generated 20.8% gross returns for investors.
How much return should we seek?
Warren Buffett has stated that, if he were managing small sums of money, he could produce annualized returns of 50% or more. Buffett’s claim here is so interesting that he has been asked this question many times at Berkshire’s annual meetings, at student talks, and elsewhere.
The highest rates of return I’ve ever achieved were in the 1950s. I killed the Dow. You ought to see the numbers. But I was investing peanuts then… I think I could make you 50% a year on $1 million. No, I know I could. I guarantee that.
- Warren Buffett, “Homespun Wisdom from the ‘Oracle of Omaha’”, BusinessWeek, July 5, 1999
I think the lack of good, comprehensive studies of stock returns is one reason why this question of Buffett has been so popular and why investors are so mesmerized by return records like the ones listed above. Most people, even after hearing Buffett say it aloud, are quietly incredulous. How could it be possible to return 50% a year?
Many investors know that an index of large-cap stocks, like the S&P 500, has produced something like 8-10% returns over the long-term, and many understand that even modest outperformance of a few percent can lead to huge long-term outperformance, but how many are familiar with incredible return performances?
I think most investors only have a vague sense of what is possible. An enterprising investor should understand what the very best return performances look like to get a sense of how high they should be shooting. When I am considering an investment, and I think it has the potential to return, say, 15% per year, should I pull the trigger or should I continue looking at other investments?
It is important for me as an investor to have an understanding of what level of stock returns has constituted greatness in the past, however defined. That way, when my research suggests that a stock might produce forward returns around some level, I might have a little more confidence around using up one of my twenty punches.2
Bessembinder’s study of great companies
In a prior article, I discussed a research study by Hendrik Bessembinder from 2017 that analyzed wealth-creation among US-listed public companies over the 90-year period from 1926 to 2016. Bessembinder showed how rare it was to find a great company that could produce dramatic outperformance over its life.
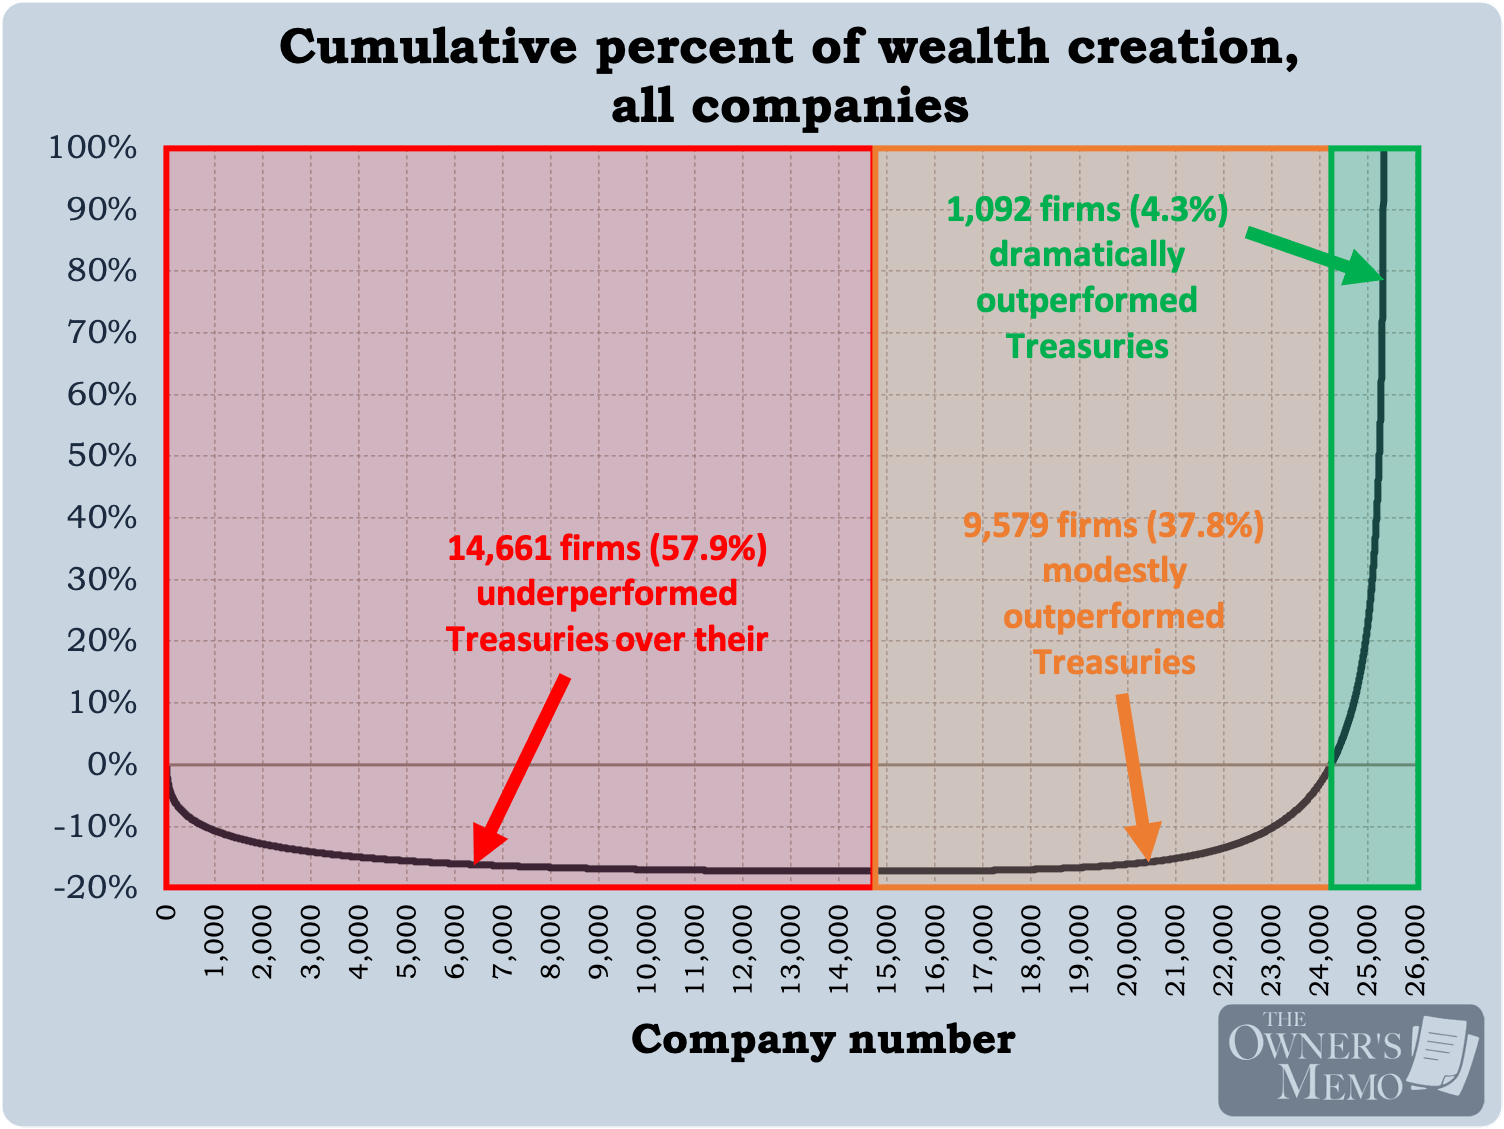
In the study, Bessembinder analyzed the dollar-wealth created by companies3, which is useful but somewhat abstract. His study was so popular, and he must have wanted to provide more performance than the dollar-wealth metric, so he published another study in 2024 that measured US companies and stocks by their compounded annualized growth rates. Many investors find it more natural to think in annualized rates, of course. The study is called Which U.S. Stocks Generated the Highest Long-Term Returns?, and it has some very interesting takeaways.
A newer study focused on annual returns
The second study is useful because it can provide a kind of gauge for the enterprising investor, as I described. It shows us how much return the best stocks have produced over various periods of time. It can help provide us with a historical point of view when aiming for returns.
Bessembinder performed his new study using the daily common stock database from the Center for Research in Security Prices (CRSP), just as he did in the 2018 analysis. However, this time he studied the 98-year period from December 31, 1925 to December 31, 2023. He analyzed 27,731 publicly listed companies and their common stocks, and he calculated the annualized returns that the stocks generated over their lifetimes.4
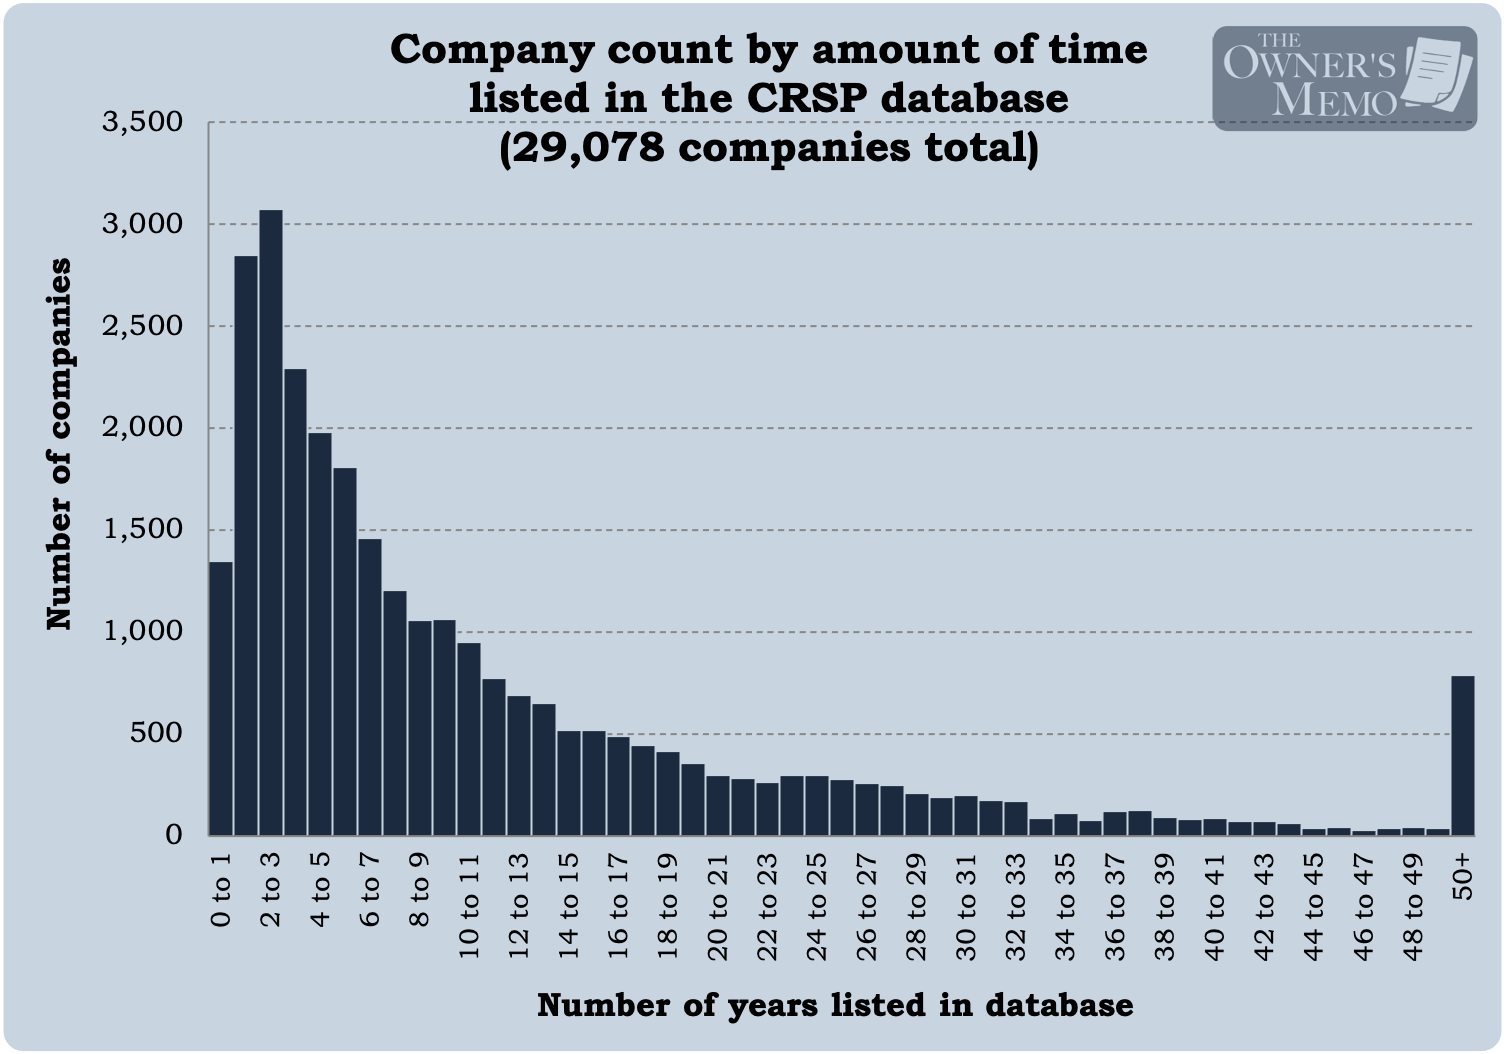
The chart below shows the amount of time that each stock was listed in the CRSP data. The median time for a stock being listed was 6.8 years, suggesting that half of all companies undergo a delisting (due to merger, bankruptcy, or other reasons) in less than that time. Only 10% of companies are in the database for 28 years or longer. Very long-lived companies are rare.
What level of annual returns have stocks produced?
Focusing now on the 27,731 stocks that were listed for more than one year, what can we glean about the annualized returns they produced?
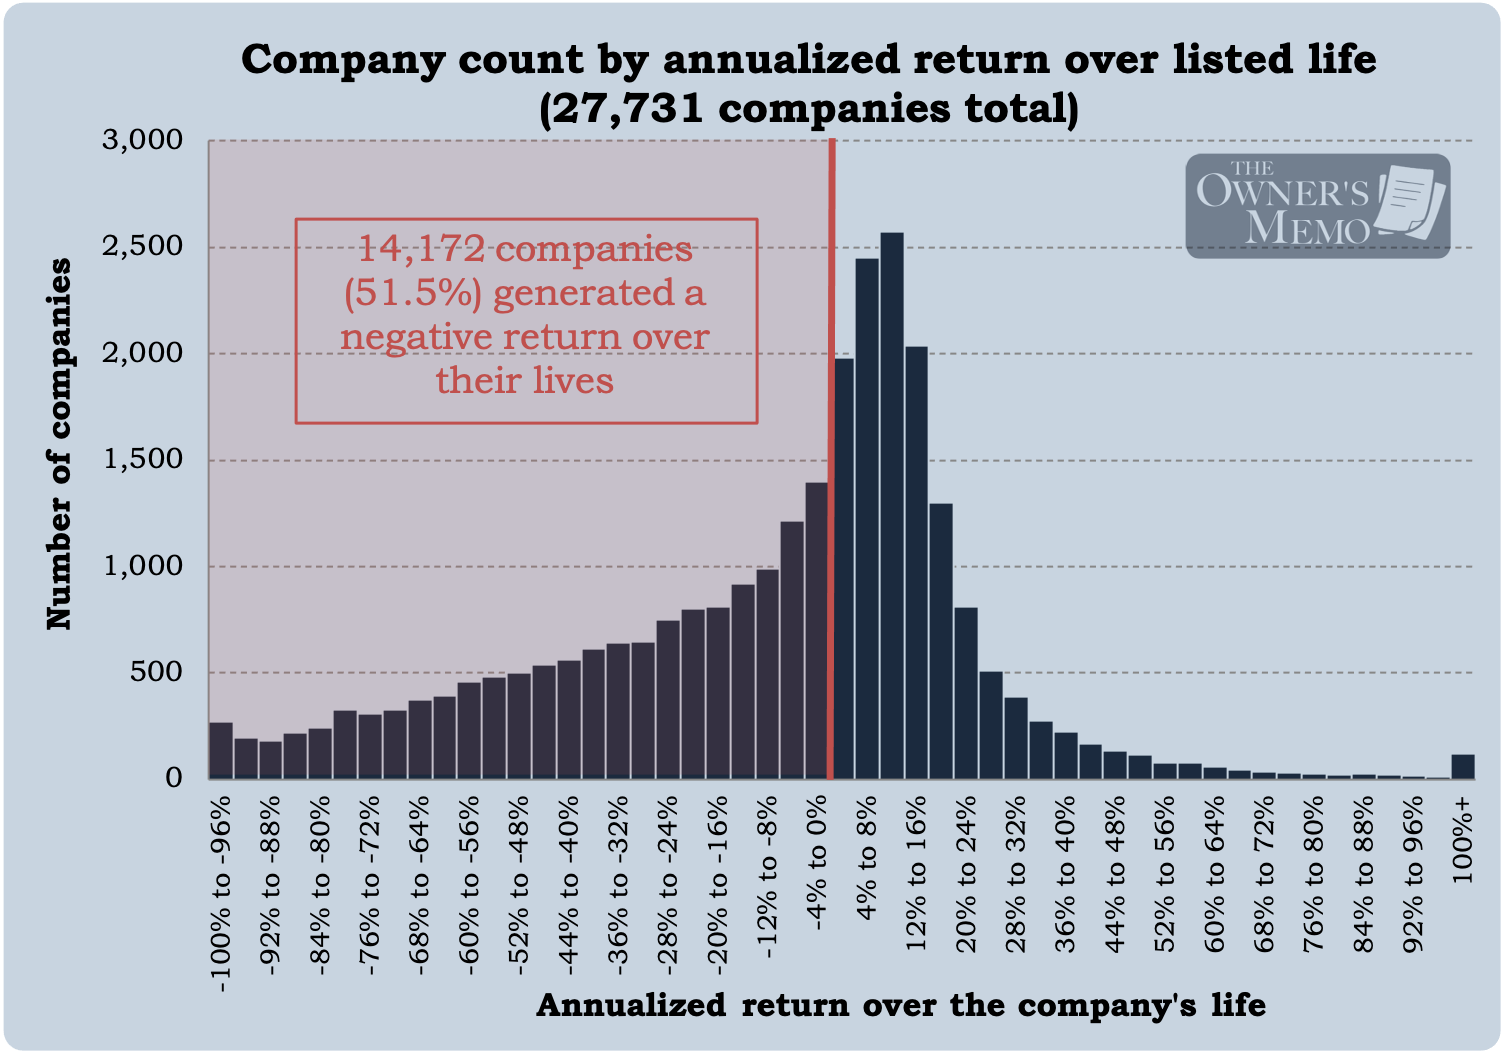
The chart below shows those stocks bucketed by the annualized return that they generated over their listed life. The black line separates stocks that generated a negative return over their lives from those that generated a positive return.
Most companies produced a negative return
One of the most striking observations is that most companies (51.1% of them) generated a negative annualized return (implying, of course, a negative outright or total return) over their lives. The median return for all stocks was -0.8%. In other words, randomly selecting a company’s stock to invest in is likely to produce a majority of outright losers over the respective lives of those companies.
How do we reconcile this with the observation that stock indexes tend to produce significant gains over the long-run? For instance, the S&P 500 produced an annualized return of 10.5% per year over the last 100 years.5
Two reasons. First, the profile shown above has a large positive skew. Even though only a minority of companies (48.9%) produce positive returns over their lives, there are enough of them, and enough that produce high returns, that it drags upward the total returns for the entire group.
Second, the S&P 500 is naturally biased to select longer-lived, stalwart companies, and that bucket is less likely to feature the loser companies. For instance, in the bucket of companies that have lives of 1 to 5 years, 63% generated a negative annualized return, while in the bucket of 20 to 40-year companies, only 30% generated a negative annualized return. (Side note: Yes, there are a lot of long-lived companies that end up with negative returns at the end of the day.)
Extremely-high returns are short-lived and likely not accessible repeatedly
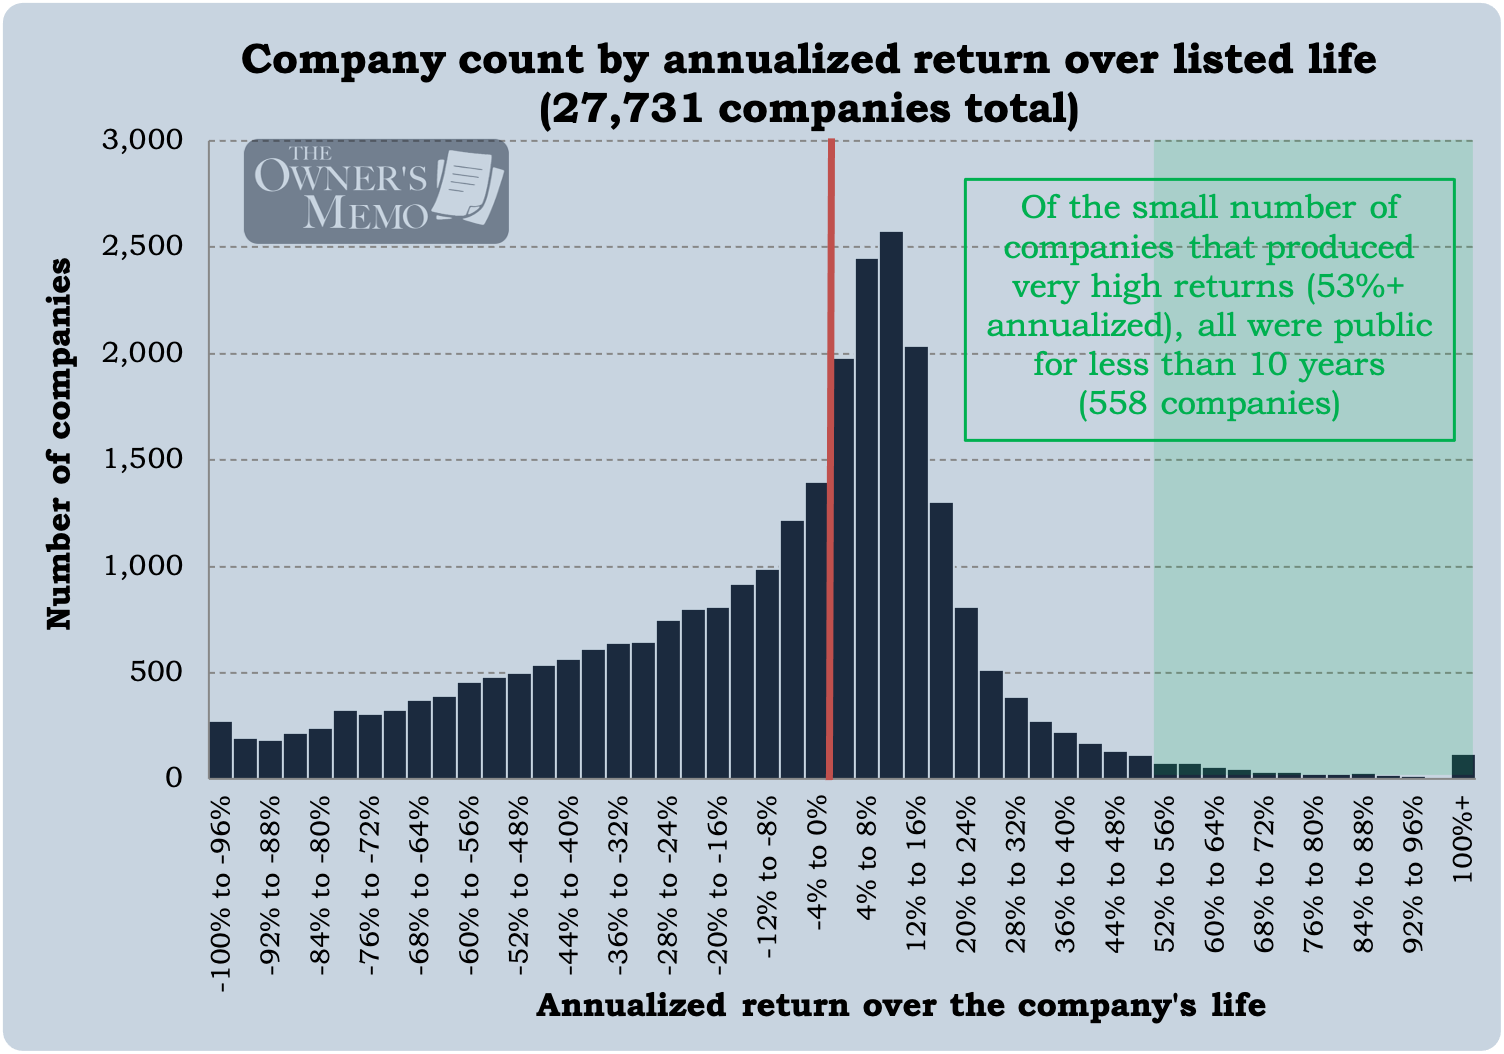
What about that long tail on the right side of the chart? There is only a small minority of firms that produce very high annualized returns over their lives. One thing is clear about those companies: they tend to have short lives. In fact, for the firms that produced annualized returns greater than 53%, none of them had lives over 10 years. Why? The highest-returning companies are bought by other firms and taken private, and, if they are not, their ability to produce very high returns abates with size and age.
The figure below shows the top 20 companies (out of 27,731) by annualized returns in Bessembinder’s study. Not surprisingly, all of these companies were listed for less than three years before they were bought and delisted. Because of their short lifetimes, almost none of these companies are familiar, but some may make good case studies in the future.
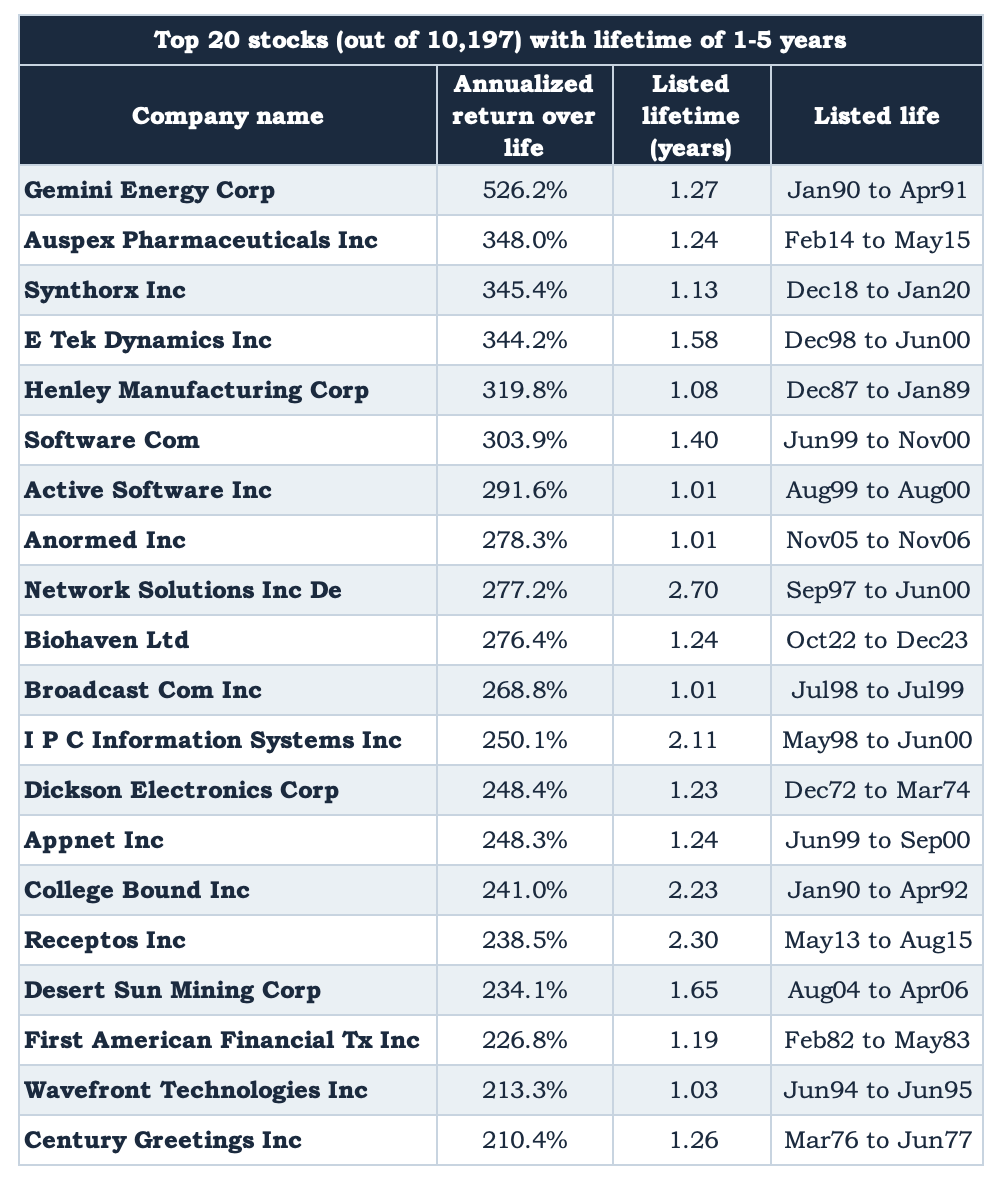
So, the first takeaway for an enterprising investor is that extremely high annualized returns are likely to be very short-term, and, because of their nature, may not be possible to capture systematically.
For example, the third company on Figure 5 is Synthorx Inc. Synthorx was a pharmaceutical company founded in 2014 that underwent an IPO in December of 2018 and was acquired by Sanofi in January 2020, in part because of one major drug that Synthorx was developing. Capturing such gains would have been difficult unless I was neck-deep in drug development research and keeping up rigorously on progress at Synthorx.
Ok, then what about company lives that are a bit longer?
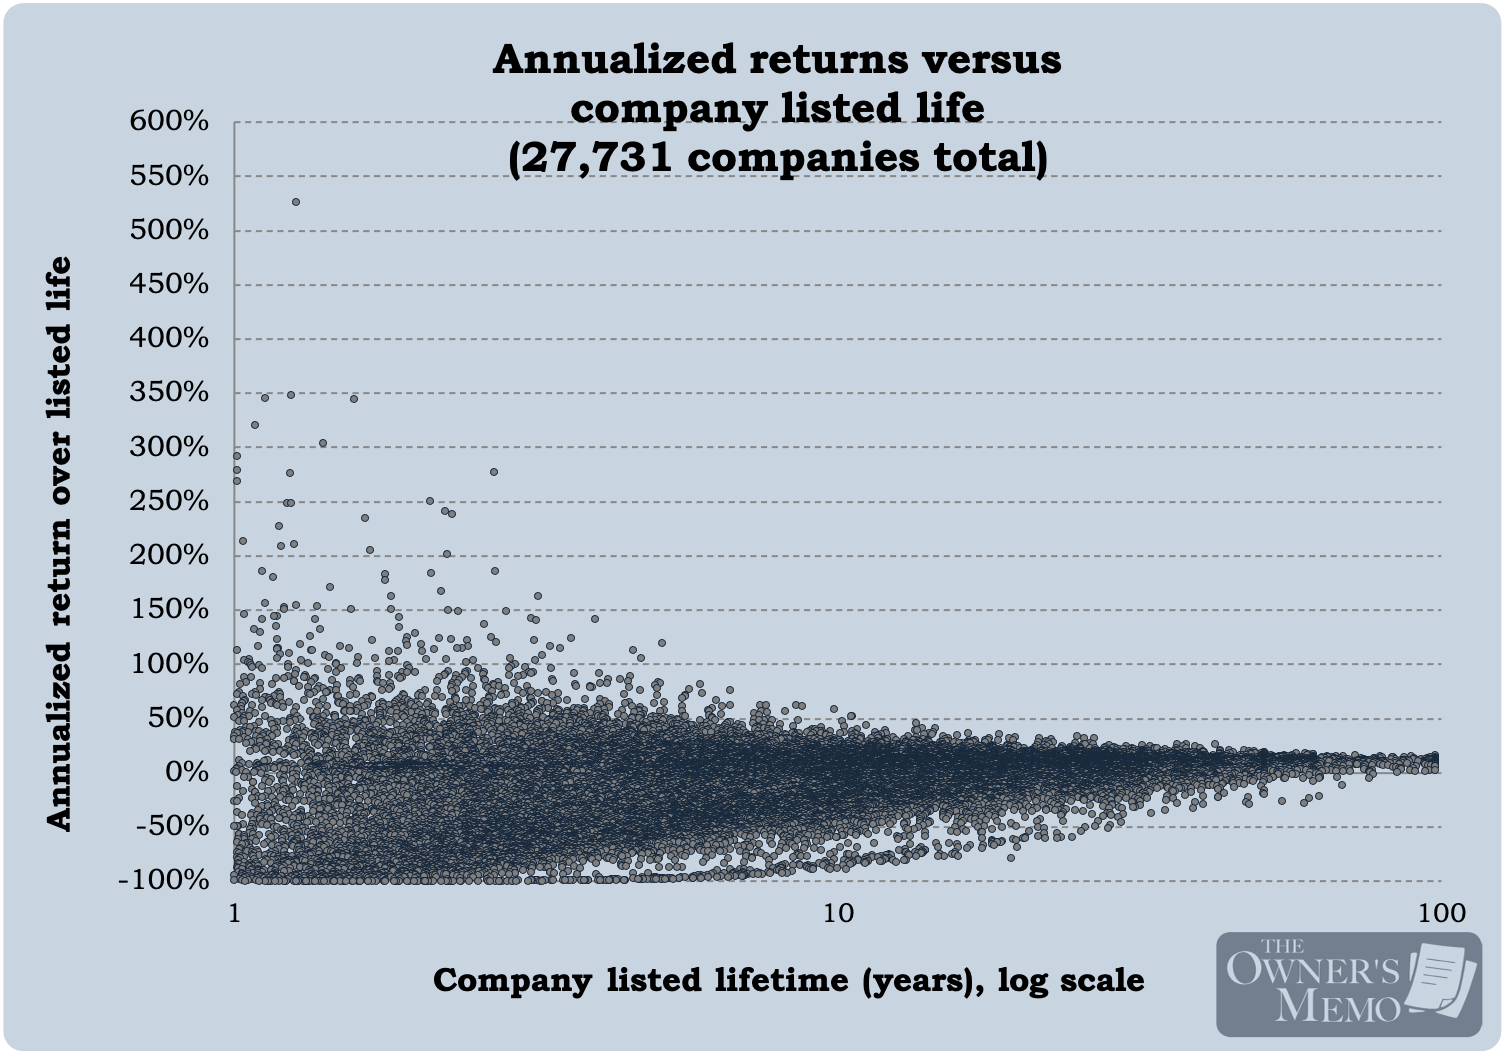
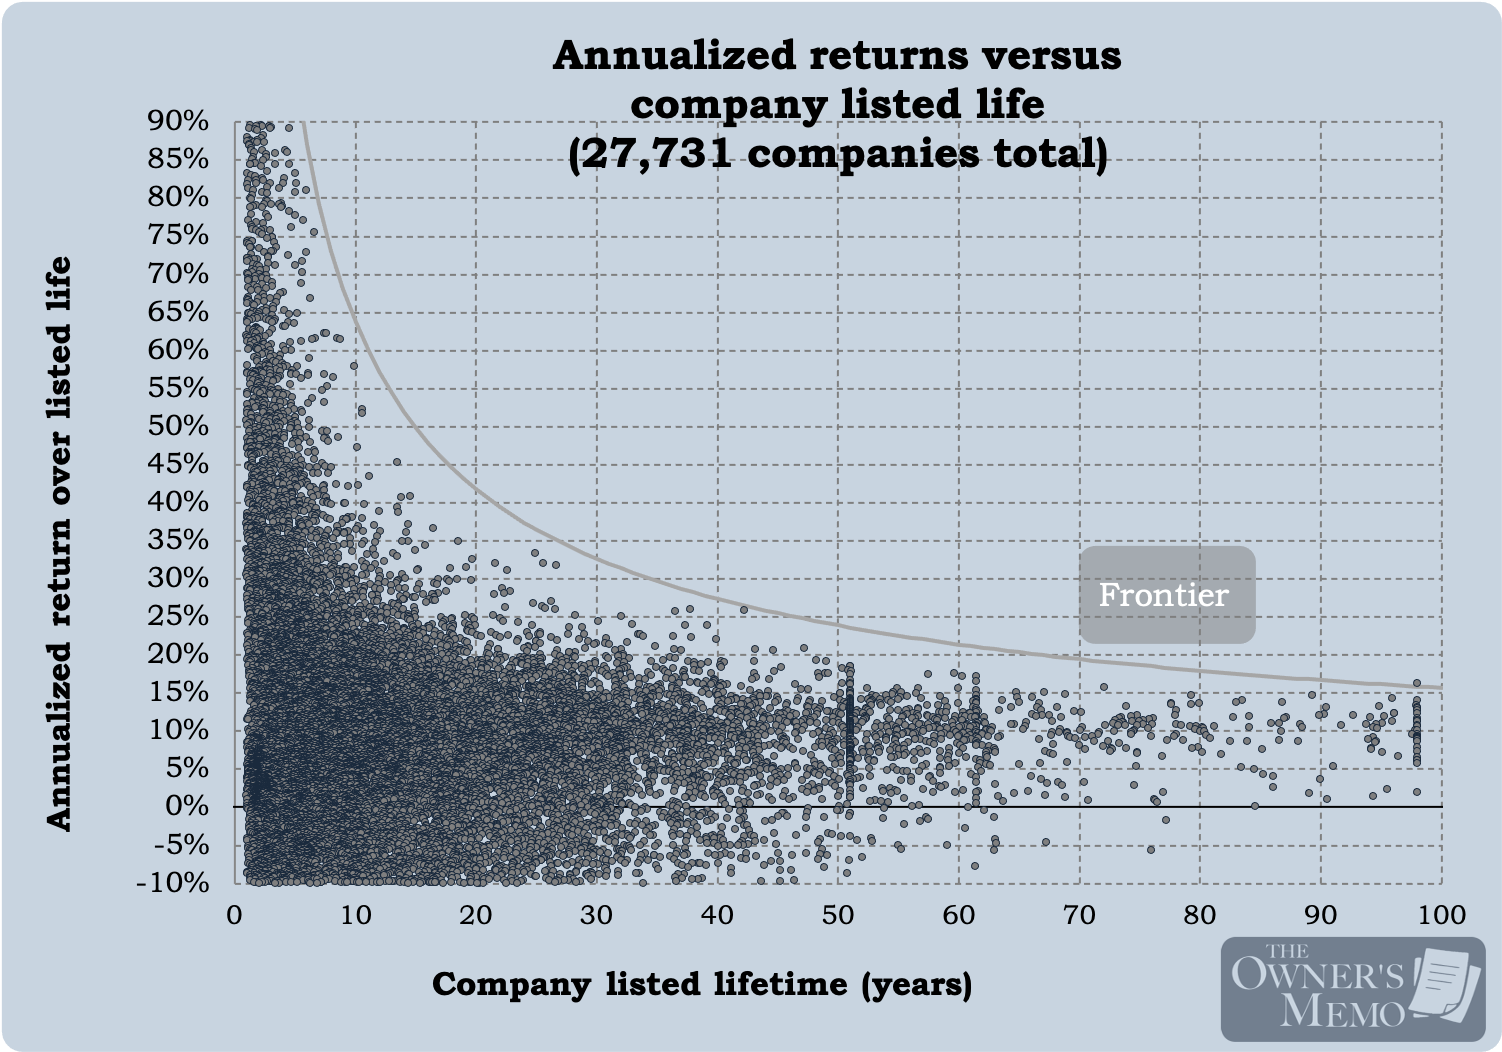
Let’s take a more detailed look at Bessembinder’s data. The figure below shows annualized returns versus the lifetime of each company for all 27,731 companies in the study. It becomes easy to see that, the longer a company is around and the larger it gets, the more difficult it becomes to keep producing astounding returns. The second chart below zooms in on the y-axis. On that chart, I’ve also drawn a crude kind of “frontier” for annualized returns generated by firms over their lifetimes. That line can give a sense for what the absolute best historical return levels have been for companies that have lived for various amounts of time.
The best returns across times
Using this data, we can get a feel for the best returns posted by the best companies over longer periods. To do that, we’ll divide the list of companies in the study into various buckets based on the lifetimes of the stocks in the database. The figure below shows the lifetime returns for companies in these buckets.
I’ve broken out companies in the 99th percentile to show the levels of returns that the very best companies have put up over their lives. I also show the median company return for comparison.
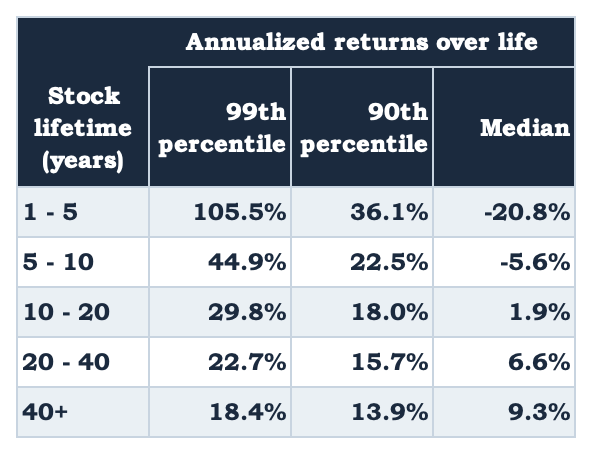
There are some astounding numbers in the above figure. Those companies in the top 99th percentile (that is, 1 out of 100) have produced annualized returns anywhere from 18.4% (over very long lives of 40+ years) to 105.5% (over very short lives). One could rightly wonder if the 99th percentile is too high a bar to be targeting, but I think it is a healthy target (1 in 100) to keep in mind for an enterprising investor who is devoting his time to sifting through many ideas in an attempt to find the very best ones. Keeping the 99th percentile returns in mind as a target also reinforces Buffett’s advice of investing with a punch card mentality: when making an investment, imagine that it is one of only 20 investments you will get to make in your life. Set the bar high.
Breaking out the return levels by stock lifetime is useful too. As mentioned before, I might be attracted to that 105.5% level of annualized returns in the 1-5 year bucket, but such stocks often produced those returns over very short lifetimes from events like buyouts that are very difficult to predict.
What about longer time frames?
What about stocks in higher lifetime buckets? There, the longer lifetimes over which great returns were generated might afford me the time to learn about the company, follow its progress, and capture some of those great returns. Indeed, the lists of companies by lifetime seem to bear that out.
The figure below shows the top 20 companies, ranked by annual returns over their lives, for four buckets: those stocks in the database for 5-10 years, 10-20 years, 20-40 years, and those with over 40 years of life.
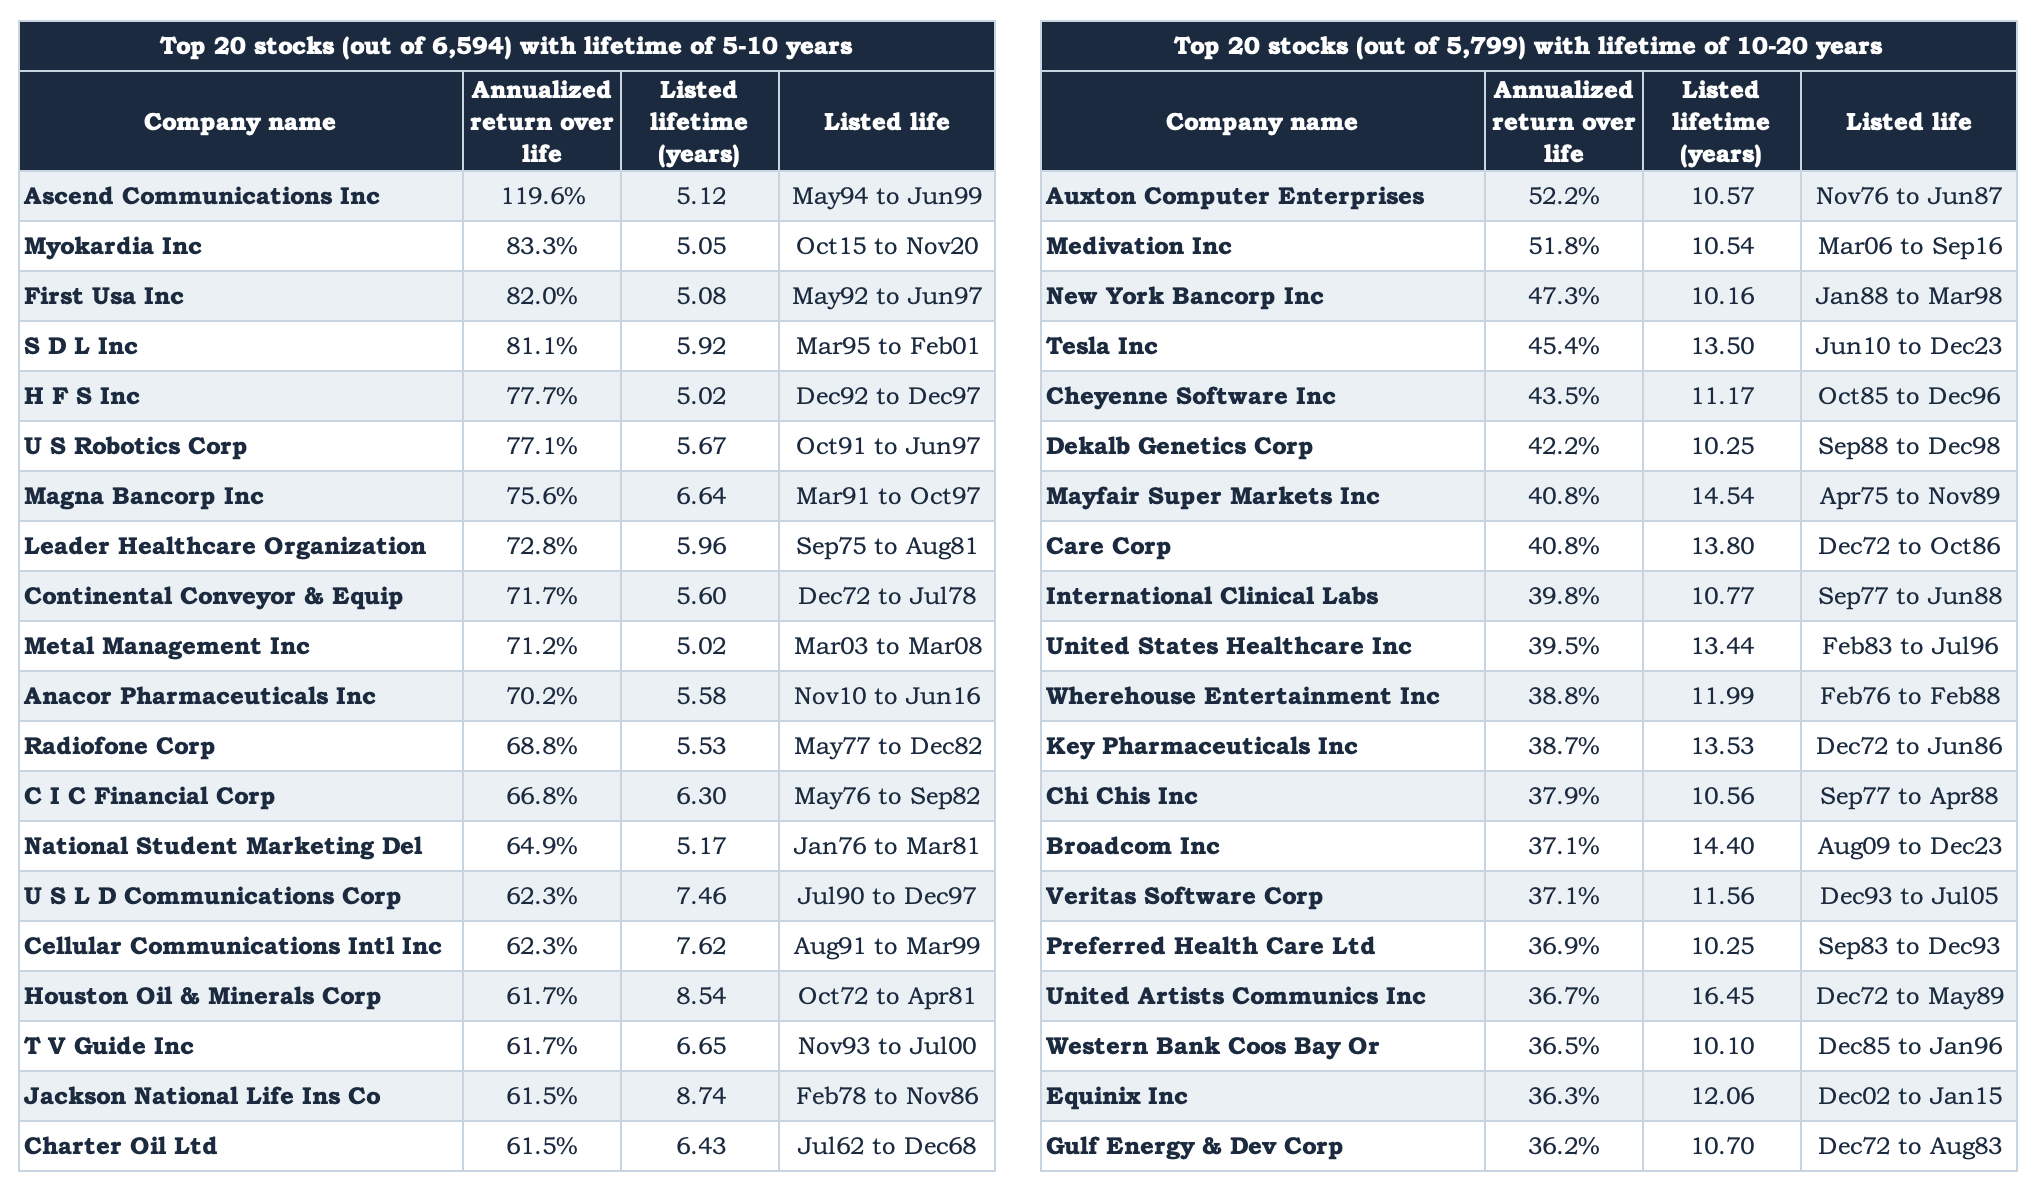
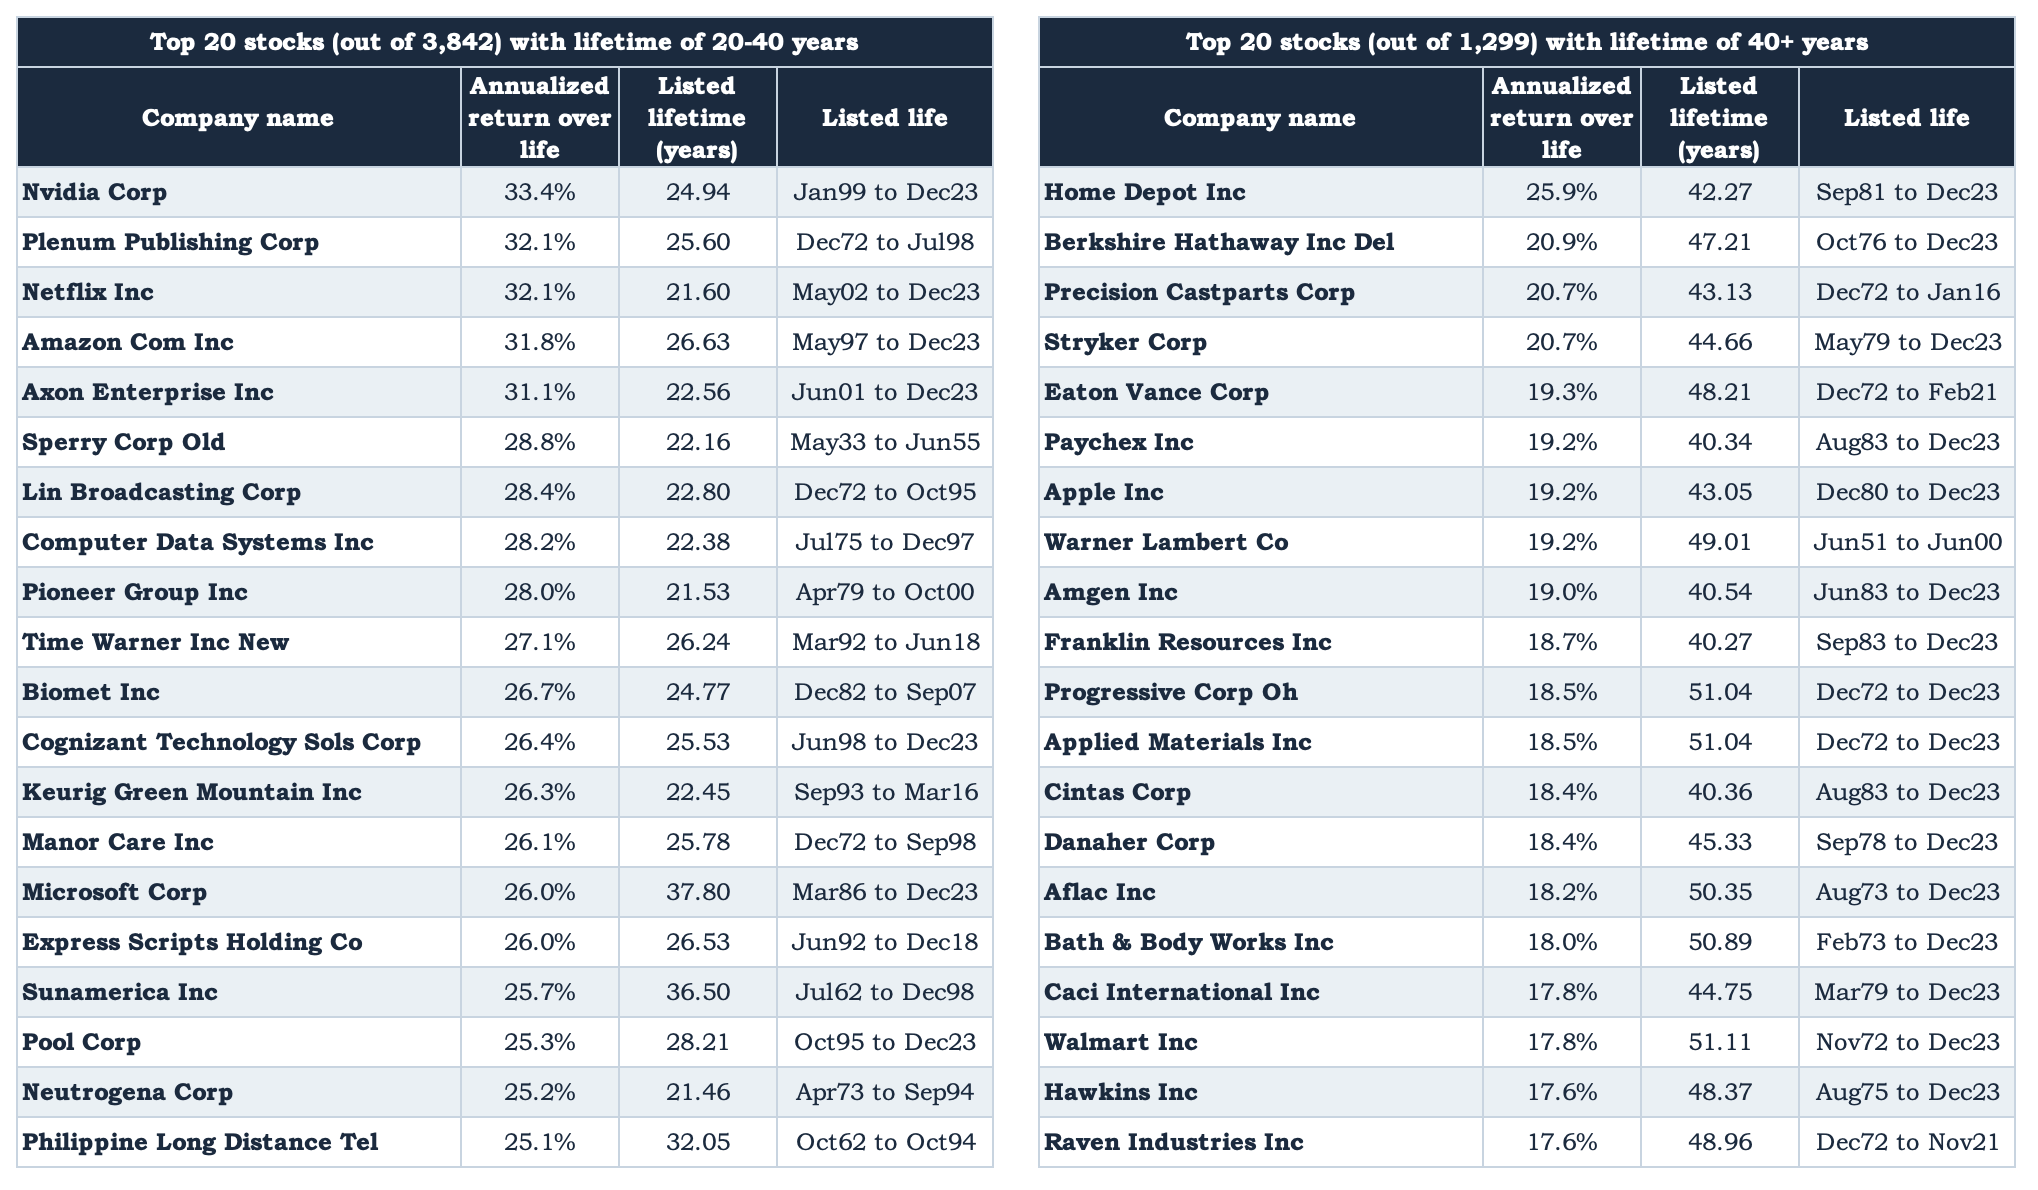
The trend I mentioned above holds for these company lists as well. Among the shorter lived companies, there seem to be several for which high returns would have been dependent on predicting a high-priced merger, which is difficult to do. In another example, US Robotics Corp is on the 1-5 year list, and it was purchased by 3Com in 1997 amid the dot-com frenzy.
As we go out further in stock lifetime, however, the degree of predictability seems to increase, and annualized returns can still be stellar. Netflix, for example, produced 32.1% annualized returns over its life from May 2002 to the end of the study at December 2023. One could complain that it would have been very difficult to predict how great a business Netflix would become in 2002, so capturing those great returns would have been difficult. However, even if we give ourselves ten years of leeway and restrict ourselves to the period from December 2013 to December 2023, the stock still returned 25.0% per year.
Return targets for the enterprising investor
It is incredibly hard to try to go back in time, and making great investments like that is always more difficult than it seems in retrospect. However, this exercise can show us just how many companies (and how few on a percentage basis) have actually put up great returns and what those levels might be for a great investor who could find them.
The companies listed in Figure 8 bear that out. The figure suggests that investing in the very best companies over the long term could produce returns that are in the rough range of 20% to 50% (judging by the companies in the 10-20, 20-40, and 40+ year lifetime lists). The data serves as a good reminder that great investment returns have been out there in the past and are likely to continue in the future.
There is one issue with the above analysis that might cause the annualized returns to be boosted a bit. The study ends at 2023, which we can think of as being 14 years into a bull market that started in 2009. Several of the top stocks in the study show December 2023 as their last listing period, which means that the returns of those stocks will be benefitting from that bull market. For example, in the bucket of stocks with 20-40 year listed lifetimes, 30% of the top returners (95th percentile) have December 2023 as their endpoint.
On the other hand, there is one critical point that argues for returns that could be even better than shown for the enterprising investor.
The returns listed are extreme buy-and-hold returns. They show the annualized returns that would have been available for an investor who simply bought each company’s stock at the time it was first listed and simply held the stock until delisting (or through December 2023). The analysis makes no accounting for valuation and company fundamentals. While there is something to be said for the simple approach, the enterprising investor should be able to increase their returns through fundamental research and buying stocks in the best companies when their market prices are suffering versus their fundamentals and future returns are likely to be higher than ordinary.
Summary and takeaways
Hendrik Bessembinder produced a valuable and unique study in 2024 that shows the best annualized lifetime returns from the stocks of publicly listed US companies.
The very best annualized returns are produced over very short lifetimes, and those may be hard to predict and thus inaccessible to an investor.
However, there are many great companies that have produced incredible lifetime returns over medium or longer terms, like 10-40 years.
An investor seeking to put up the best possible performance should be shooting for annualized returns in the range of the very best companies and above. Data from the Bessembinder study suggests that number could be the 20-50% range.
To be fair, the data may be biased high because the end of the study coincides with a bull market.
On the other hand, the enterprising investor may be able to obtain even higher levels than those cited above by leveraging fundamental research and buying stocks in the best companies when their market prices are depressed.
Warren Buffett: Buffett Partnership Ltd. letter dated January 22, 1969
Charlie Munger, Walter Schloss, Bill Ruane, and Tom Knapp: The Superinvestors of Graham-and-Doddsville, printed in Hermes, the Columbia Business School Magazine in 1984.
Ted Weschler: Statement by Ted sent to ProPublica, June 2021
Joel Greenblatt: You Can Be A Stock Market Genius by Joel Greenblatt, returns audited
George Soros: Soros, The World’s Most Influential Investor by Robert Slater
Stan Druckenmiller: https://www.reuters.com/article/business/duquesnes-druckenmiller-retiring-after-30-years-idUSN18196020/
Jim Simons: Jim Simons, a Pioneer of Quantitative Trading, Dies at 86, Wall Street Journal, May 10, 2024
Peter Lynch: Magellan Fund data from the Center for Research in Securities Prices
Lou Simpson: Berkshire Hathaway annual letter, 2004
Nick Sleep and Qais Zakaria: The Full Collection Of The Nomad Investment Partnership Letters To Partners, 2001 – 2014
I wrote some more on Buffett’s punch card analogy in “Becoming a Better Investor”.
The study defines dollar-wealth creation as the accumulation of market value from the starting period to the ending period in excess of the value that would have been obtained from investing an equal amount in one-month Treasuries.
The lifetime of a stock starts with its first traded prices after its initial listing or IPO and ends with its last traded price, either in December 31, 2023 if the company is still around or when the stock was delisted due to a merger or a negative development, like bankruptcy. Bessembinder’s study started with 29,078 stocks, and he dismissed 1,347 of them that were listed in the database for less than one year, because extrapolating annualized returns for those might be too misleading, leaving 27,731 stocks as subjects for the study.
S&P 500 returns from officialdata.org, citing Robert Shiller.