


Last week, I wrote about the concept of owner earnings and illustrated it with a short case study of RingCentral, a stock that returned 129% in the 6 1/2 months since I discovered it in April.
As a reminder, “owner earnings” are a concept popularized by Buffett as a way of emphasizing that a discerning investor should be looking beyond a company’s reported earnings figures to understand how much of those earnings a company can actually keep and use.
I quoted Buffett in his 1986 letter to Berkshire Hathaway shareholders, describing the concept using the company Scott Fetzer, which he labels “Company N,” and I’ll repeat the quote here as a reminder:
If we think through these questions, we can gain some insights about what may be called “owner earnings.” These represent (a) reported earnings plus (b) depreciation, depletion, amortization, and certain other non-cash charges such as Company N’s items (1) and (4) less (c) the average annual amount of capitalized expenditures for plant and equipment, etc. that the business requires to fully maintain its long-term competitive position and its unit volume. (If the business requires additional working capital to maintain its competitive position and unit volume, the increment also should be included in (c). …)
In the case of RingCentral back in April of 2026, the company’s owner earnings were substantially higher than its reported GAAP net income for 2025 ($43.4 million) due to the high amount of depreciation and amortization ($222.6 million) the company was expensing and the relatively low amount of CapEx ($87.2 million) the company needed.
RingCentral’s stock price was $37.81 per share in April. That implied a P/E ratio on 2025 earnings of 73.3 times, but an “owner earnings” P/E of only 12.6 times. Furthermore, management had provided long-range (three to four year) targets that, if hit, implied an “owner earnings” P/E of only 5.8 times.
From April 2, 2026, RingCentral’s stock rose 129% to a price of $86.31 on October 26.
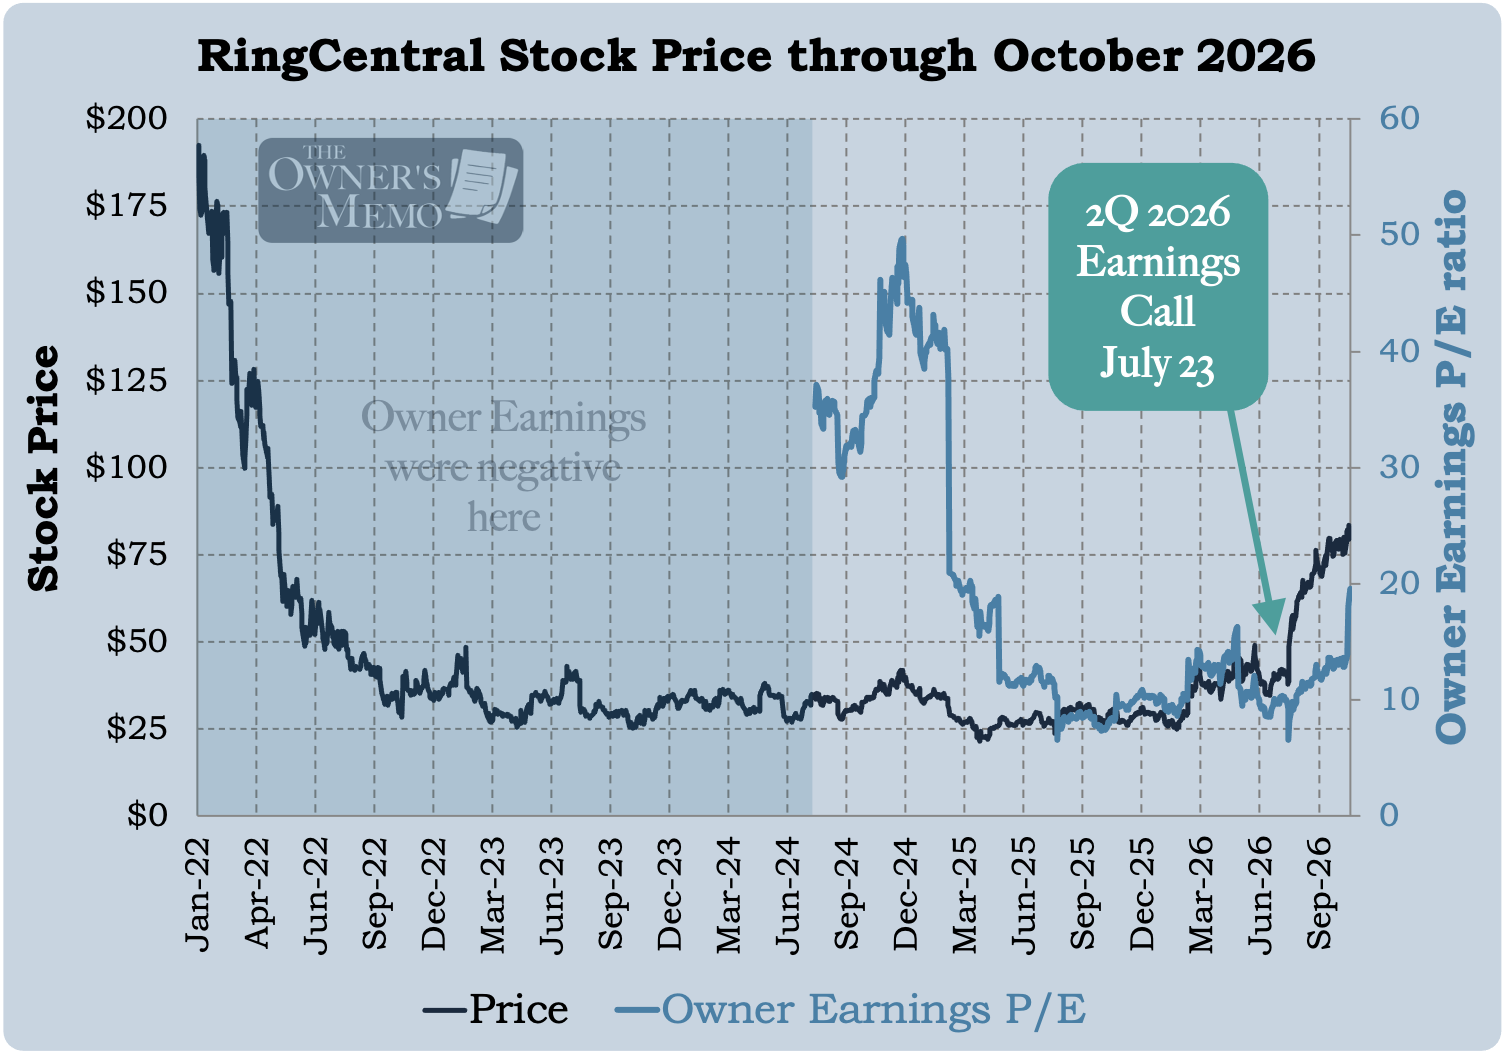
In reviewing the investment, I was struck by how RingCentral’s stock languished for a long time and then suddenly rose. The stock was roughly flat from the end of 2022 through the start of 2026 and into the company’s 2Q 2026 earnings call on July 23. Then, in one day, from the close on July 23 through the close of July 24, the stock went from $38.62 to $48.31, up 25.1%.
Now, you might be tempted to call the earnings release a catalyst, but the story is a little more muddled.
On one hand, you could describe the earnings call as a catalyst because management highlighted the fact that operations were improving faster than expected. They reported anticipating hitting their long-range operating margin target in “two to three years,” rather than “three to four”:
Our disciplined focus on profitability has put us ahead of schedule on GAAP operating margin. We now expect to reach our 20% target within two to three years, a year ahead of schedule.
On the other hand, nothing on that call was dramatically different than what the company had discussed on a few prior calls. They were confident in their ability to hit those targets, and now they were proving it.
So what are we to think about the sudden rise in RingCentral’s stock?
When I look back, I see a few ingredients that I like to keep in mind as an investor hunting for the next opportunities:
For much of the time that RingCentral’s stock languished, the company was not cheap on the basis of its owner earnings. As Figure 1 shows, the owner earnings P/E ratio, which I calculated in the same way as discussed last week, was either negative or above 30 times. Only as of February 20, 2025 (with the company’s 4Q 2024 earnings report) did the owner earnings P/E drop from 37.7 to 20.9. As of May 8, 2025 and the 1Q 2025 earnings report, the owner earnings P/E dropped again from 18.8 to 11.5 with no sizable move in the stock price. Waiting for explicit cheapness was the right move.
After that, the company was more clearly cheap than before, and the market still allowed an investor 8 1/2 months to purchase at similar prices before the stock’s price started to rise in February 2026. Importantly, RingCentral’s cheapness was somewhat “hidden” by the high depreciation and amortization charge that was weighing down GAAP earnings (but that became apparent after calculating the company’s owner earnings).
Management was forecasting an increase in operating performance that would result in owner earnings getting even better in the future. (When the company outperformed these measures as reported on the 2Q 2026 earnings call, the stock price jumped.)
The company was consistently repurchasing stock in a display of confidence in its forward forecast and the cheapness of its stock. From the end of 1Q 2025 through 3Q 2026, the company spent $537.6 million on a net basis to repurchase shares, taking the outstanding share count down from 90.5 million to 83.5 million. Such repurchases boost per-share earnings figures and lower P/E ratios beyond what would occur from the simple improvement of business operations.
RingCentral’s performance throughout the year was great, but can it help us find any current investment opportunities? Can we find another company that exhibits these characteristics?
With that in mind, I went back to the place I discovered RingCentral: Value Line. Could there be any other stocks on the lists of “Biggest ‘Free Flow’ Cash Generators” and among those stocks with the “Lowest P/Es” that might sport a higher level of owner earnings than GAAP net income?1 Recently, I went through both lists to try to do just that. I scanned each list and brought up the financials for company after company using Fiscal.ai, my tool of choice at the moment.
I was looking for companies that had relatively:
low levels of net income,
high levels of depreciation and amortization costs, and
low levels of capital expenditures,2
all versus the company’s market valuation.
The following figure shows one of the lists I looked through. It is a list of the “Biggest ‘Free-Flow’ Cash Generators” from the November 6 edition of the Value Line Small and Mid-Cap Investment Survey.3
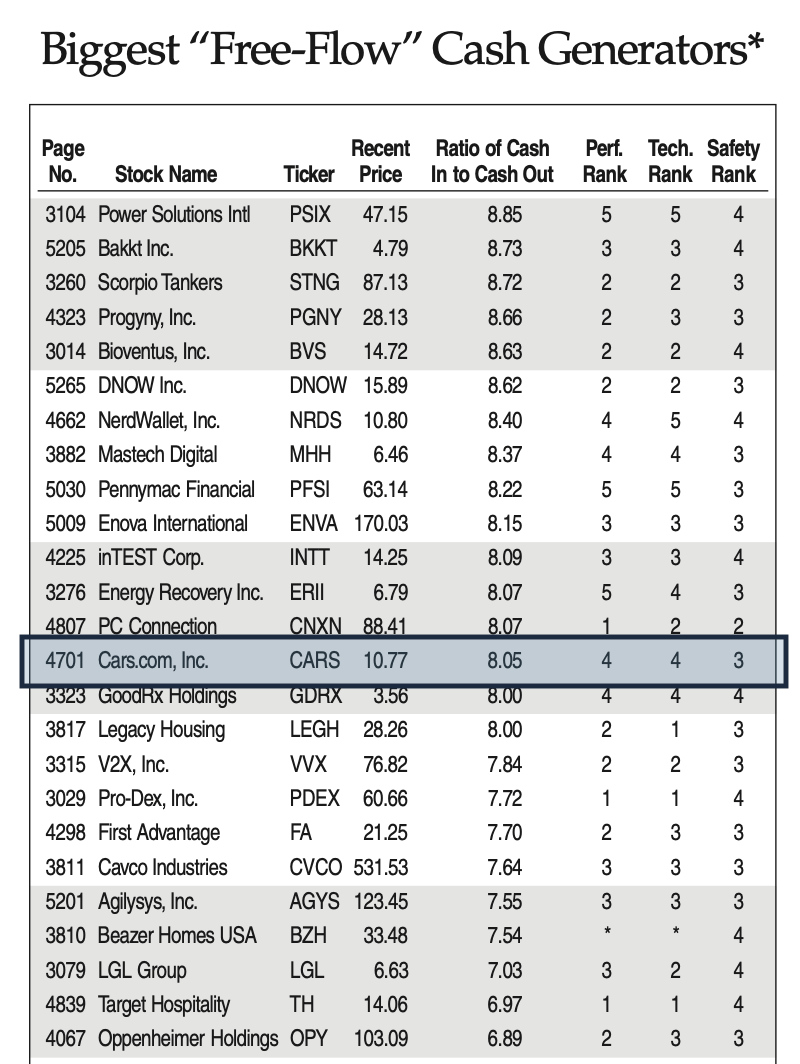
After looking through many different names on this list and others, I struck upon one that seemed promising, and after reviewing it further, seemed similar in some ways to RingCentral: Cars.com.
Cars.com (ticker: CARS)
Cars.com Inc. was founded in 1998. Its flagship product, the cars.com website, is a marketplace where car dealers can pay to advertise and list new and used vehicle inventories to consumers searching for cars to buy. The company also has other product lines to serve dealers and auto OEMs. They report revenue in four segments:
Marketplace - the cars.com website, including subscription revenue from dealers and associated add-ons,
Digital Experience - operating websites for dealers,
Media Solutions - various products to help dealers advertise and generate leads, and
Trade & Appraisal - helping dealers appraise and purchase used cars, via the AccuTrade business line.
The company competes with others in the digital auto industry, including CarGurus, Autotrader, TrueCar, CarMax, and Carvana. Increasingly, Meta and Alphabet are quasi-competitors as well, since dealers can spend advertising budget with those companies, rather than with any direct online marketplace. As you might suspect, the business of selling cars via an online marketplace is a competitive one.
From the 2025 10-K report:
Our direct competitors are online automotive marketplaces, such as CarGurus, AutoTrader and TrueCar. We also compete with other automotive websites, such as CARFAX, Edmunds and Kelley Blue Book. We also compete with dealer software and marketing services providers such as Cox Automotive and DealerOn. Additionally, we compete for consumer audience with platforms, such as internet search engines, generative AI chat engines, online dealerships, social media marketplaces and online consumer marketplaces.
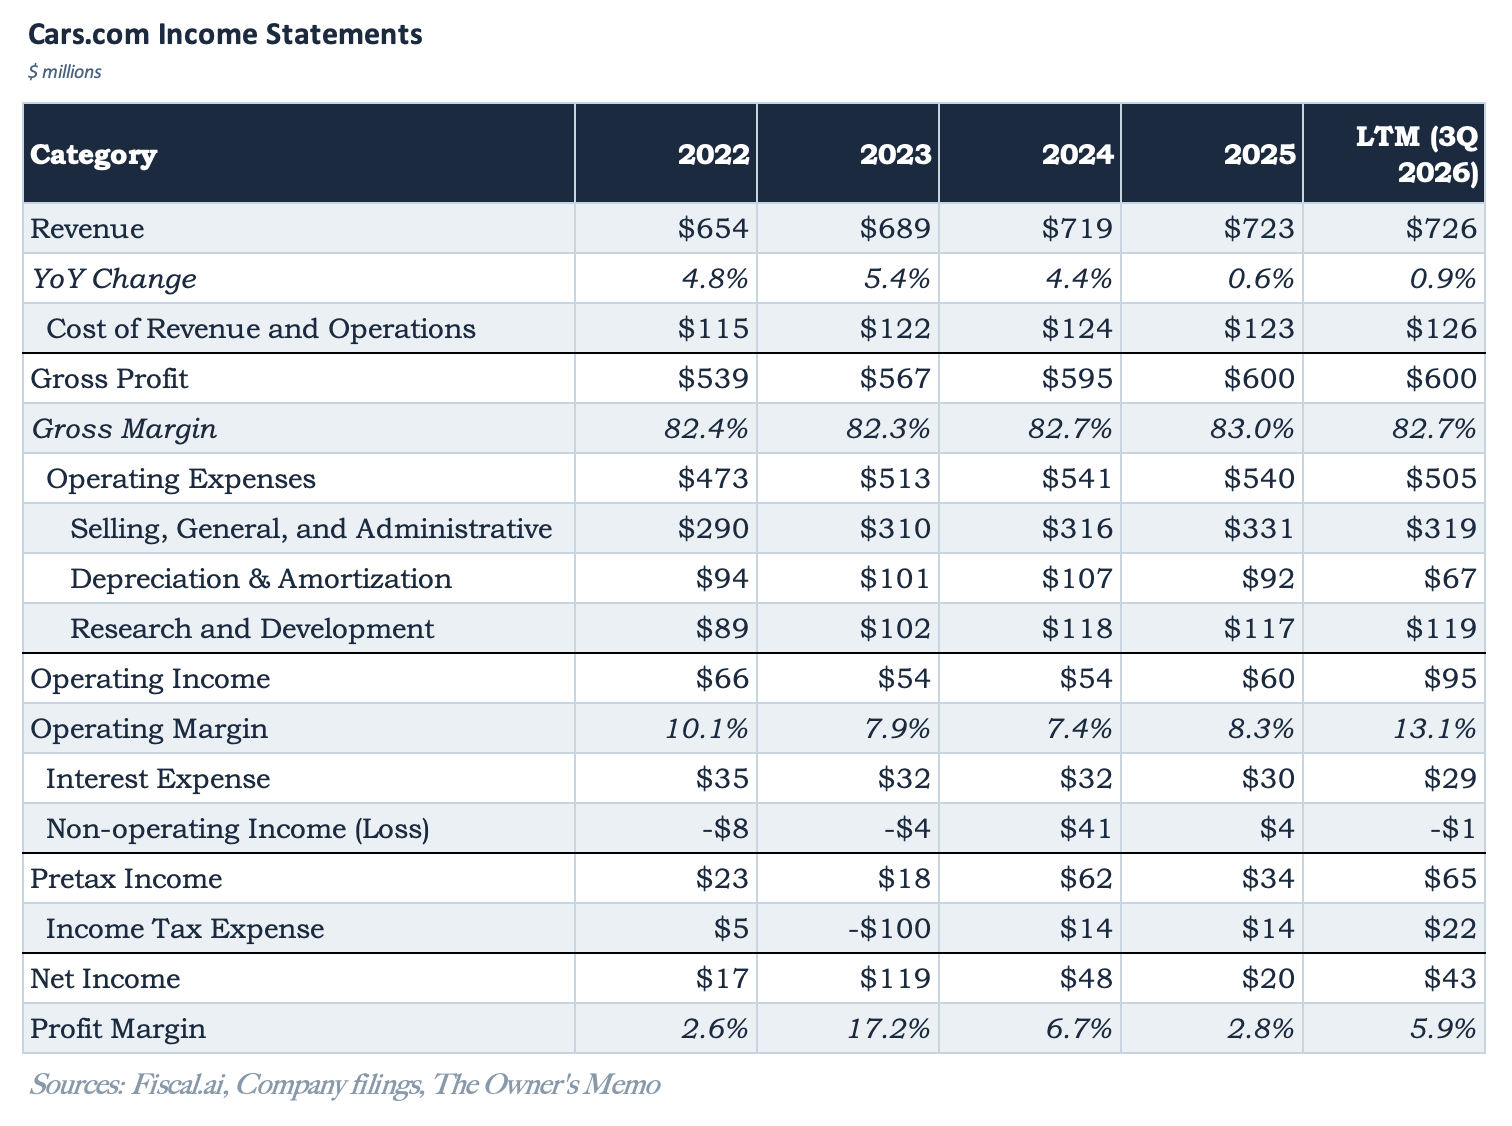
That competitive intensity can be seen in the company’s income statements. Cars.com just reported 3Q 2026 results on November 5. Over the past nearly five years, revenue has risen by a modest 11% in total. Over the last twelve months, the company generated $726 million in revenue and $43 million in net profit, for a profit margin of 5.9%, good but not exactly stunning.
So, why are we interested in Cars.com?
Well, a deeper look at the company’s cash flow statement tells another, more positive story, one of a company that generated $151.8 million in cash from operating activities over the last twelve months and spent only $23.2 million on CapEx.4
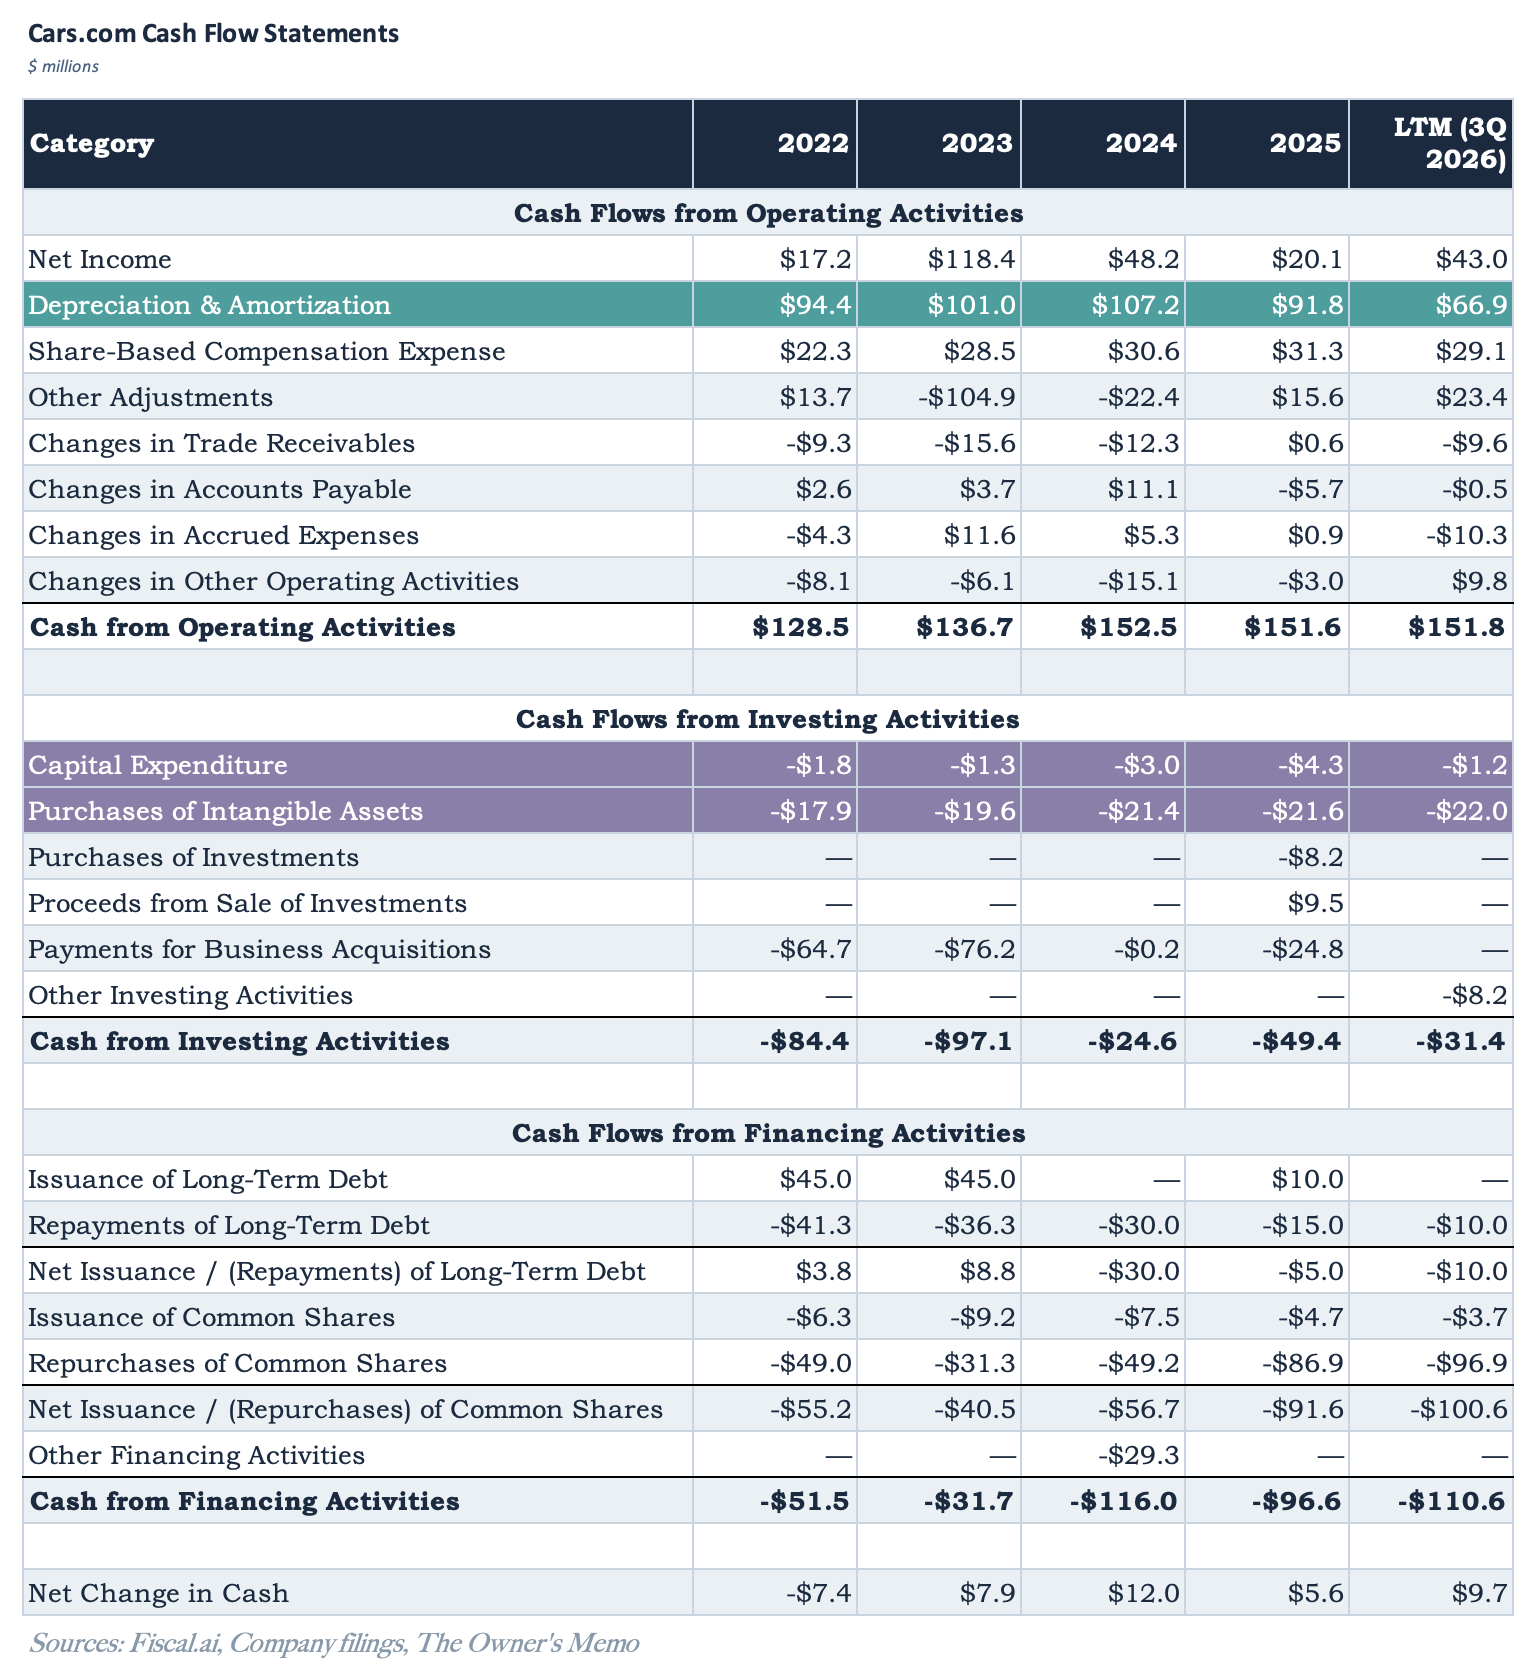
In the cash flow statement above, we can see the factors I was scanning for: high depreciation and amortization charges coupled with low capital expenditures.
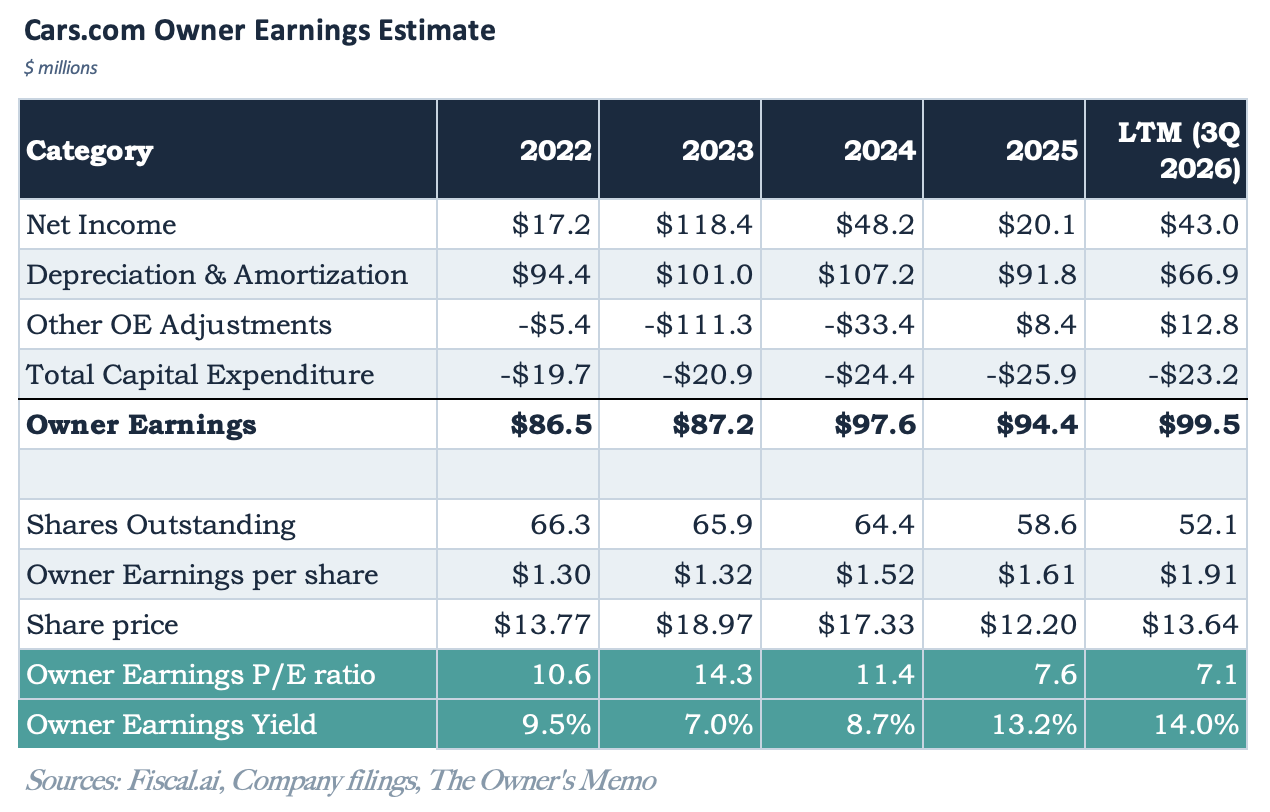
Using the income and cash flow statements, we can put together a simple calculation showing the company’s owner earnings over time.
On this basis, Cars.com seems much more attractive.
The company recently traded at a stock price of $13.64, as of mid-day November 6, for a market cap of $710.3 million and an enterprise value of $1.09 billion.
Although net income and “other adjustments” on the cash flow statement swing around a bit, Figure 5 shows that Owner Earnings have been more consistent, and they totaled $99.5 million for the last twelve months, a figure that has risen by 15% over the past nearly five years.
As the highlighted rows show, Cars.com currently trades at an “owner earnings” P/E ratio of 7.1 times, for an owner earnings yield of 14.0%.
Also, Cars.com has been a constant repurchaser of its own shares, which has boosted owner earnings per share for the company over time. Moreover, the company ramped up repurchases in 2025 and 2026 when the stock price fell, exactly the kind of thoughtful capital allocation an investor likes to see.
Figure 6 below shows the stock price history for Cars.com, along with a TTM P/E ratio based on owner earnings, as calculated above. The stock traded at an owner earnings P/E level above 10 times for most of 2022 through 2024. Then, after a price decline following 4Q 2024 earnings on February 27, 2025, the stock dipped below that level into the single digits.
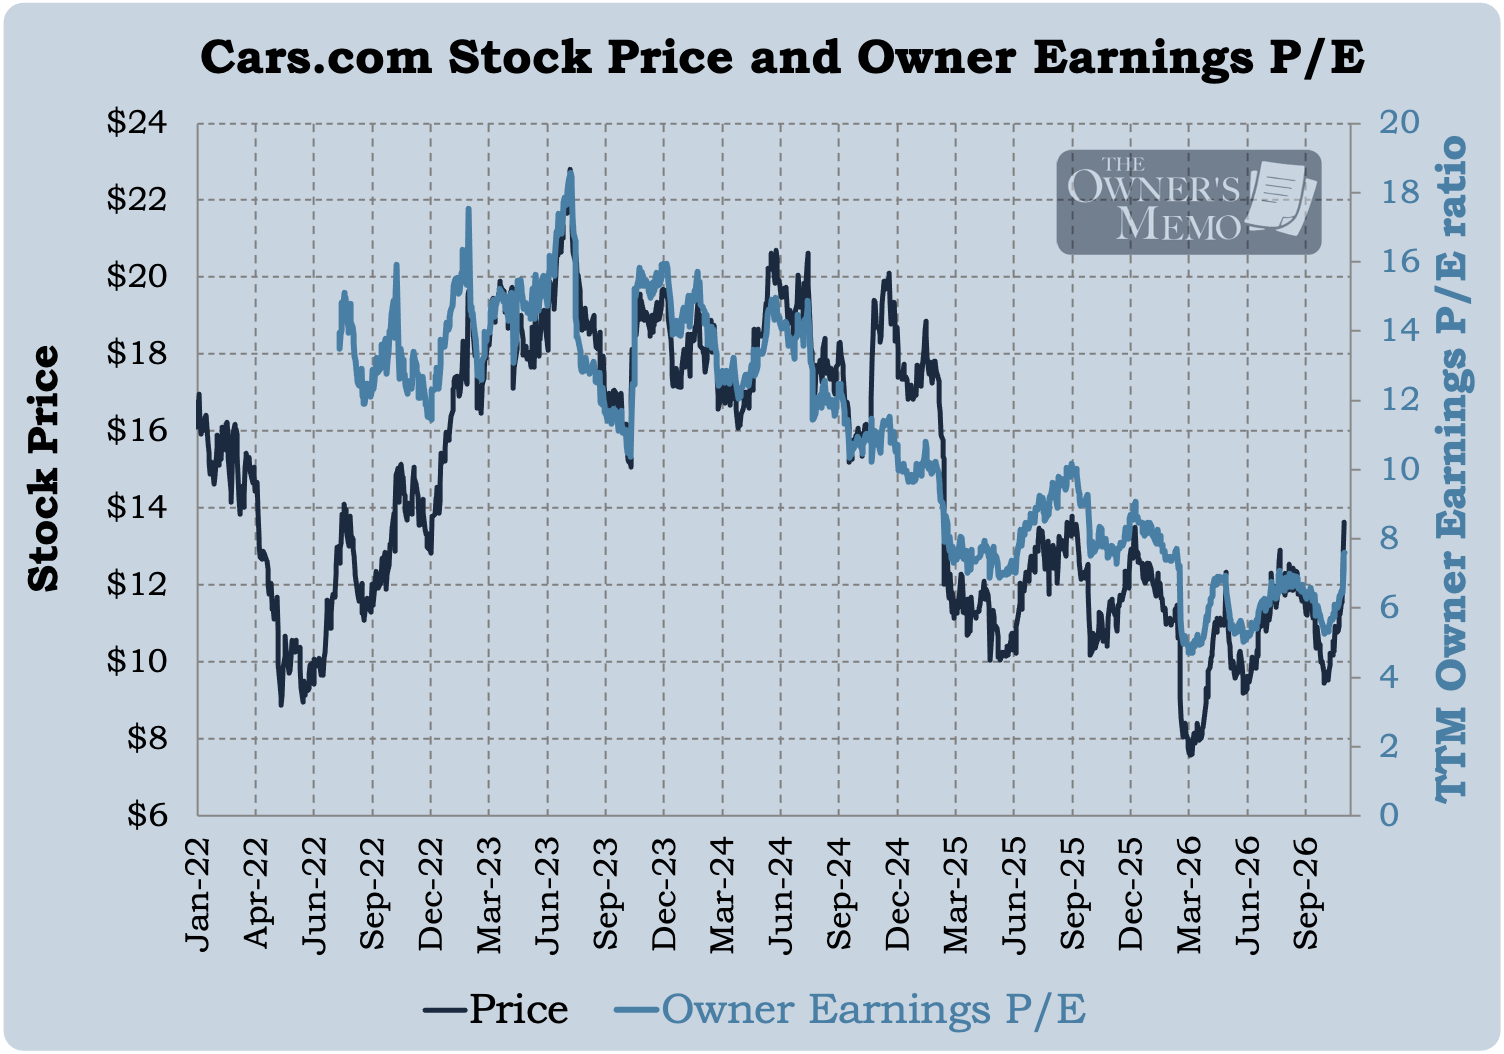
An earnings yield of 14.0% seems cheap for a business that has consistently generated owner earnings like Cars.com has.
Why So Cheap?
As you might suspect, Cars.com is not without risks, and the biggest ones stem from competition and the threat of AI. On the competitive landscape, for example, CarGurus, perhaps the most direct competitor to Cars.com, grew its revenue by 11.5% YoY as of 3Q 2026, versus 0.2% for Cars.com. Meta and Alphabet, while not direct competitors to Cars.com, also pose significant threats.
The threats from AI are a bit less developed and more nebulous at this point. Will chatbots or agents become a major way people find their cars in the future? Does that mean dealerships will see less purchase business from the Cars.com website, weakening the value of a subscription?
Management discussions and disclosures on the topic of competition are somewhat sanguine, but they’re also vague. On the positive side, on the 3Q 2026 conference call on November 5, management cited how popular its own AI chatbot, Carson, was with leading large-language models:
Off-platform, third-party data shows that Carson continued to lead automotive marketplace peers in the number of citations by the largest LLMs in Q3.
And in its earnings presentation, management cited how popular its website was, as shown in the graphic below.

Naturally, we should be balanced in our assessment as much as possible. It would be imprudent to take management at their word here, and it would be equally imprudent to dismiss their claims as salesmanship or the like. The landscape for AI advertising and lead generation is new and evolving, and it is difficult to assess. I think the most balanced view I can take at the moment is that AI could be a powerful technology for Cars.com to integrate in its products, which could create value for customers and dealers, while being wary about the possibility that AI model companies one day begin more direct dealer partnerships, cutting out Cars.com in the process.
We do have two other sets of hard data that Cars.com regularly reports: traffic to its web properties and the number of Average Monthly Unique Visitors. The company defines Traffic as “the number of visits to Cars.com desktop and mobile properties (responsive sites and mobile apps),” and that figure totaled 150.2 million visits in 3Q. AMUVs totaled 24.7 million. I show both below in Figure 8.
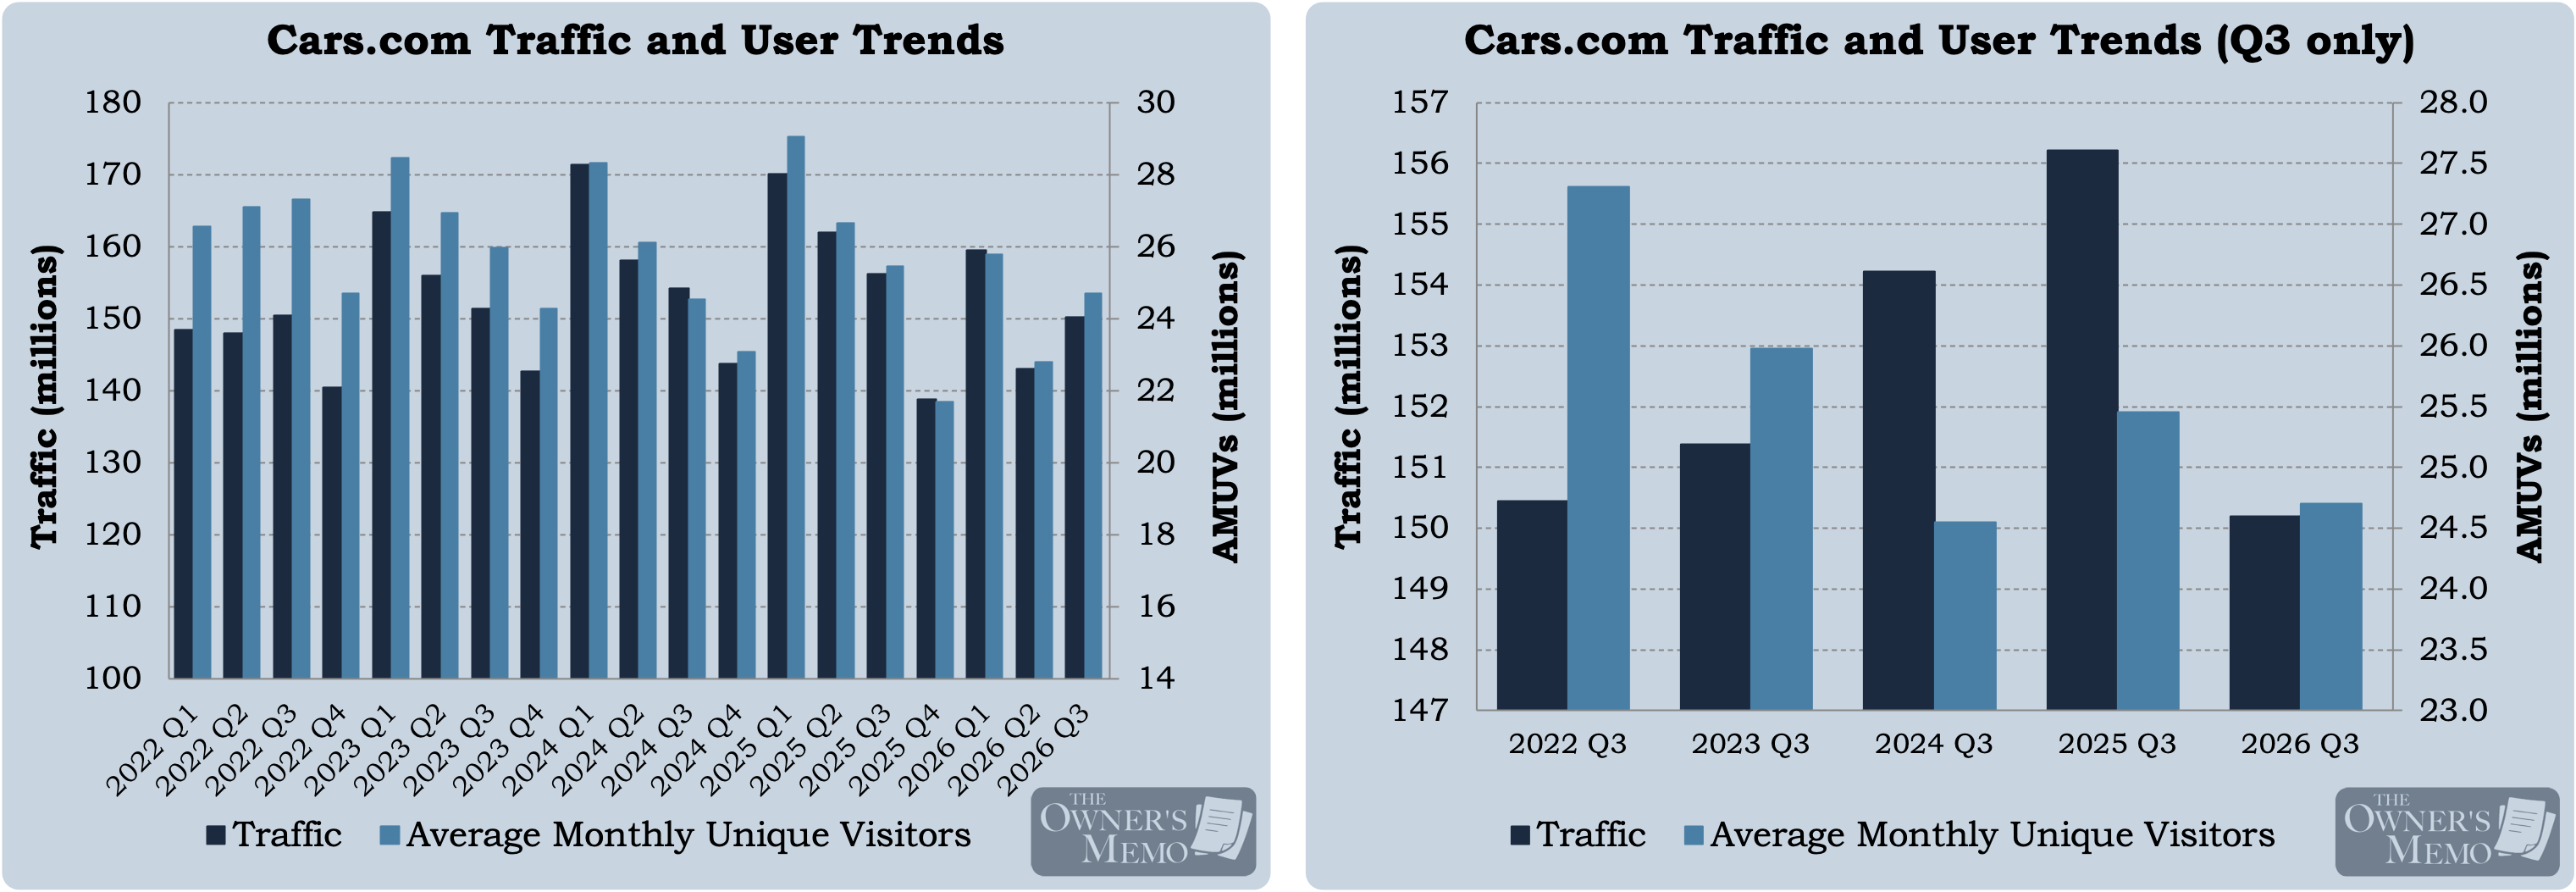
The left figure shows Traffic and AMUVs for each quarter since 1Q 2022, and the right figure shows the same data isolating only the 3Q figures to eliminate any seasonality.
As you can see from the chart on the left, the traffic and visitor counts to Cars.com properties are seasonal and seem to have been broadly consistent over the past five years. But the seasonality can mask trends, and we can get a better feel for that by isolating any given quarter, like I did in the chart on the right.
There, we see what might be a concerning development: traffic was increasing to Cars.com properties from 2022 through 2025, but fell in 2026. Furthermore, the number of users declined from 2022 to 2024, increased in 2025, and then decreased in 2026.
Of the two measures, I regard the visitor counts (light blue bars) as more important. Those figures give a better feel for actual people using the Cars.com marketplace. (If traffic were up and user counts down, that simply indicates that the average user was visiting the marketplace more times during the month in their hunt for a car.)
So, from the data, it appears that competition, whether from other online marketplaces, Meta and Alphabet, or the LLMs is indeed having some impact on Cars.com.
On the other hand, management discussed the trend in traffic on its earnings calls throughout 2026. Here is what they said on the 2Q earnings call:
In terms of our overall marketplace audience, the year-over-year decline in Q2 traffic and visitors primarily reflects strategic shifts to prioritize value delivery.
[…]
Based on the clearly favorable customer response that fueled marketplace revenue and subscriber growth in Q2, we will continue to de-emphasize lower-quality traffic, opting instead to drive more value to dealers.
Management is saying that the company was adopting a strategy to refine its marketing spend, deliberately removing low-quality traffic and leads (along with the associated marketing spend) in order to gather higher-value leads.
As of the recent 3Q call, management believes the strategy is working:
With regards to traffic to the website, I think we’ve outlined our strategy, which was that we would de-emphasize a little bit just driving traffic as opposed to driving leads. I think we’re very happy that this strategy has worked. Traffic and UVs are recovering from first-half levels, and that we’ve seen we’re de-emphasizing still the traffic, but we drove nearly double-digit increase on leads. You’re basically seeing that the strategy on efficiency works.
And, yes, one can see this modest success with the improvement in traffic and users in the 3Q 2026 data in the left chart in Figure 8.
The Verdict
Cars.com has a pretty good business, serving the auto dealership community, primarily through its online marketplace where it generates leads and helps dealers make sales. The company also does not appear to be overly expensive, generating $99.5 million in owner earnings, at a recent market cap of $710.3 million, for an owner earnings P/E multiple of 7.1 or an earnings yield of 14.0%.
However, the business is not a great one, as evidenced by the company’s near-zero revenue growth over the past two years and increased competition.
When I compare Cars.com to RingCentral, on the basis of the four features I mentioned earlier in the article, some things are the same: a cheap valuation based on “hidden” owner earnings and a management team that is nicely committed to returning the majority of those earnings back to shareholders in the form of share repurchases.
However, Cars.com falls short on the basis of point #3 from above (potential increase in operating performance).
First, RingCentral’s products, while also bearing competition from the likes of Zoom and Microsoft, were still generating increased revenue, and management was forecasting another rise in revenue for FY 2026 (4-5%) that was consistent with its 2025 print. Moreover, the company could point to concrete success it was having in adopting AI in its product base, with 40% to 120% growth in three new products and “AI-related revenue” accounting for 10% of ARR in 2025 from near-zero in 2023. When I review the Cars.com reports and earnings transcripts, I hear some success they’re having with Carson, their AI assistant, but nothing as concrete.
Second, and perhaps more importantly, the RingCentral management team projected clear targets for operating improvements into the future, most notably a “three to four year” forecast for operating margins to improve to 20%, from 4.8% in 2025. Targets like that are rare (in part because management teams are highly disincentivized to provide them), so I tend to give them weight when I hear them, as long as the management team has past credibility of course. Here, the forecasts allowed an investor to see that RingCentral was trading at an owner earnings P/E of 5.8 times based on those forecasts.
The Cars.com management team, while having done a good job removing $30–35 million in annual operating expenses recently, does not provide any such longer-term guidance, even one year out. That makes me suspect they are as uncertain about the competitive landscape as I am and that they don’t yet have a clear understanding of what costs might be trimmed from the business in response.
Although Cars.com appears to be cheap, at a 14.0% owner earnings yield, it doesn’t quite rise to the level of an obvious buy for these reasons. At the very least, I need to dig deeper on the competitive landscape, but for now, this goes in the “too hard” pile.
That’s not easy to say because I suspect the stock will do just fine from here. (If you asked me to take an educated guess, I’d say the stock returns something like its owner earnings yield over the next few years.) Also, at lower prices, certainly owner earnings yields in the 25%+ range, which corresponds to a price around $8.36 or lower on next year’s earnings, I would be inclined to change my mind.5 It’s a far cry from the stock’s current $13 range, but good investing research involves patience and having a view on what price is simply too cheap.
For now, I think the enterprising investor will be better served continuing to search for companies where the story is clearer, including management even providing clearer guidance in plain sight, and the cheapness is there too.
“Why use Value Line, Tim?” you might ask. Why not use more modern techniques to find companies? I think a good investor should be canvassing the landscape as much as possible to find ideas. For instance, I used screening with Bloomberg in a prior series, and I intend to showcase a variety in the future, including efforts using AI.
The word “relatively” is bearing a lot of weight here. What we want is a company with as much D&A as possible versus its maintenance CapEx. The greater the difference between D&A and CapEx, the more we will be adjusting net income upward in our calculation of owner earnings. Then, obviously, we want that adjusted owner earnings figure to be as large as possible versus the price we’re paying for the stock, whether on the basis of market cap or enterprise value.
Value Line publishes effectively two editions of its product, the main Value Line Investment Survey and the Small and Mid-Cap Investment Survey covering smaller companies in a bit less detail.
Their “Biggest ‘Free-Flow’ Cash Generators” list isn’t exactly perfect. A note at the bottom describes it as showing “Stocks of companies that have earned more ‘cash flow’ in the last 5 years than was required to build plant and pay dividends.” It makes no mention of the valuation at which these companies trade relative to the cash they generate, and because of its 5-year view, some of the companies may have eroded as of late. This is one area where Value Line is a bit weaker than some good stock screening tools.
Note that “Purchase of Intangible Assets” in the Cars.com cash flow statement as reported by Fiscal.ai represents capitalized costs for internally developed technology, and, as such, I count it as a part of CapEx.
My estimate of next year’s owner earnings per share is $2.09. It assumes that the company’s revenue and operating performance are the same as the prior twelve months and that the company commits another gross $90 million for stock repurchases (along with $29 million of stock-based comp) at current prices, taking its share count down to 47.6 million.