

Li Lu’s 7x Return on Timberland: The Breakdown (Part 3)
The Owner's Memo #5

In the previous two installments of this case study (Part One and Part Two), I walked through Li Lu’s discovery of Timberland in the fall of 1998: how it surfaced from the reading the Value Line manual, how he worked through the four concerns that had pushed the price down, and how his visit to the management’s home town outside of Boston (including their synagogue!) convinced him that the people running the company were the kind he wanted to ride alongside.
In the end, Li held the stock for about two years and made roughly seven times his money.
A little more to learn from Li Lu
After publishing the article, a friend of mine told me how much he enjoyed reading it and that he wanted to know a little more. Eddie runs a successful hedge fund, so he knows a thing or two about what constitutes a great investment. He wanted to see what it was exactly that helped Li Lu earn that 7x return in Timberland.
Breaking down returns with John Bogle
The return on a common stock can be decomposed, after the fact, into three sources:
The investor receives dividends along the way.
The earnings of the business grow or shrink.
The multiple the market is willing to pay for those earnings expands or contracts.
Put the three together and you have the stock’s total return over the time it was held.
That framework is most often associated with John Bogle, the famous investor and founder of Vanguard, who set it out in the Journal of Portfolio Management in 1991 and refined it with Michael Nolan in a 2015 paper titled Occam’s Razor Redux. Although the purpose of the work was forecasting stock market returns, the same logic works perfectly well as a backward-looking attribution. It is the cleanest way to ask whether a given return came from the business or from the mood of the market.

In the case of an individual stock, the earnings-growth piece can be dissected further. Earnings per share are simply revenue per share multiplied by the net margin of the company, so growth in earnings per share comes from (1) selling more stuff, (2) keeping more of each dollar sold, and/or (3) shrinking the share count through buybacks.
That gives us five neat drivers for the price performance of a stock:
The dividends received.
The earnings per share, broken down into
Revenue per share
Net profit margin, and
Share repurchases.
The multiple the market is willing to pay.
Timberland in 1998 makes for an very interesting case of this exercise. In some ways, Timberland was an ideal investment.
Li Lu’s Timberland returns broken down
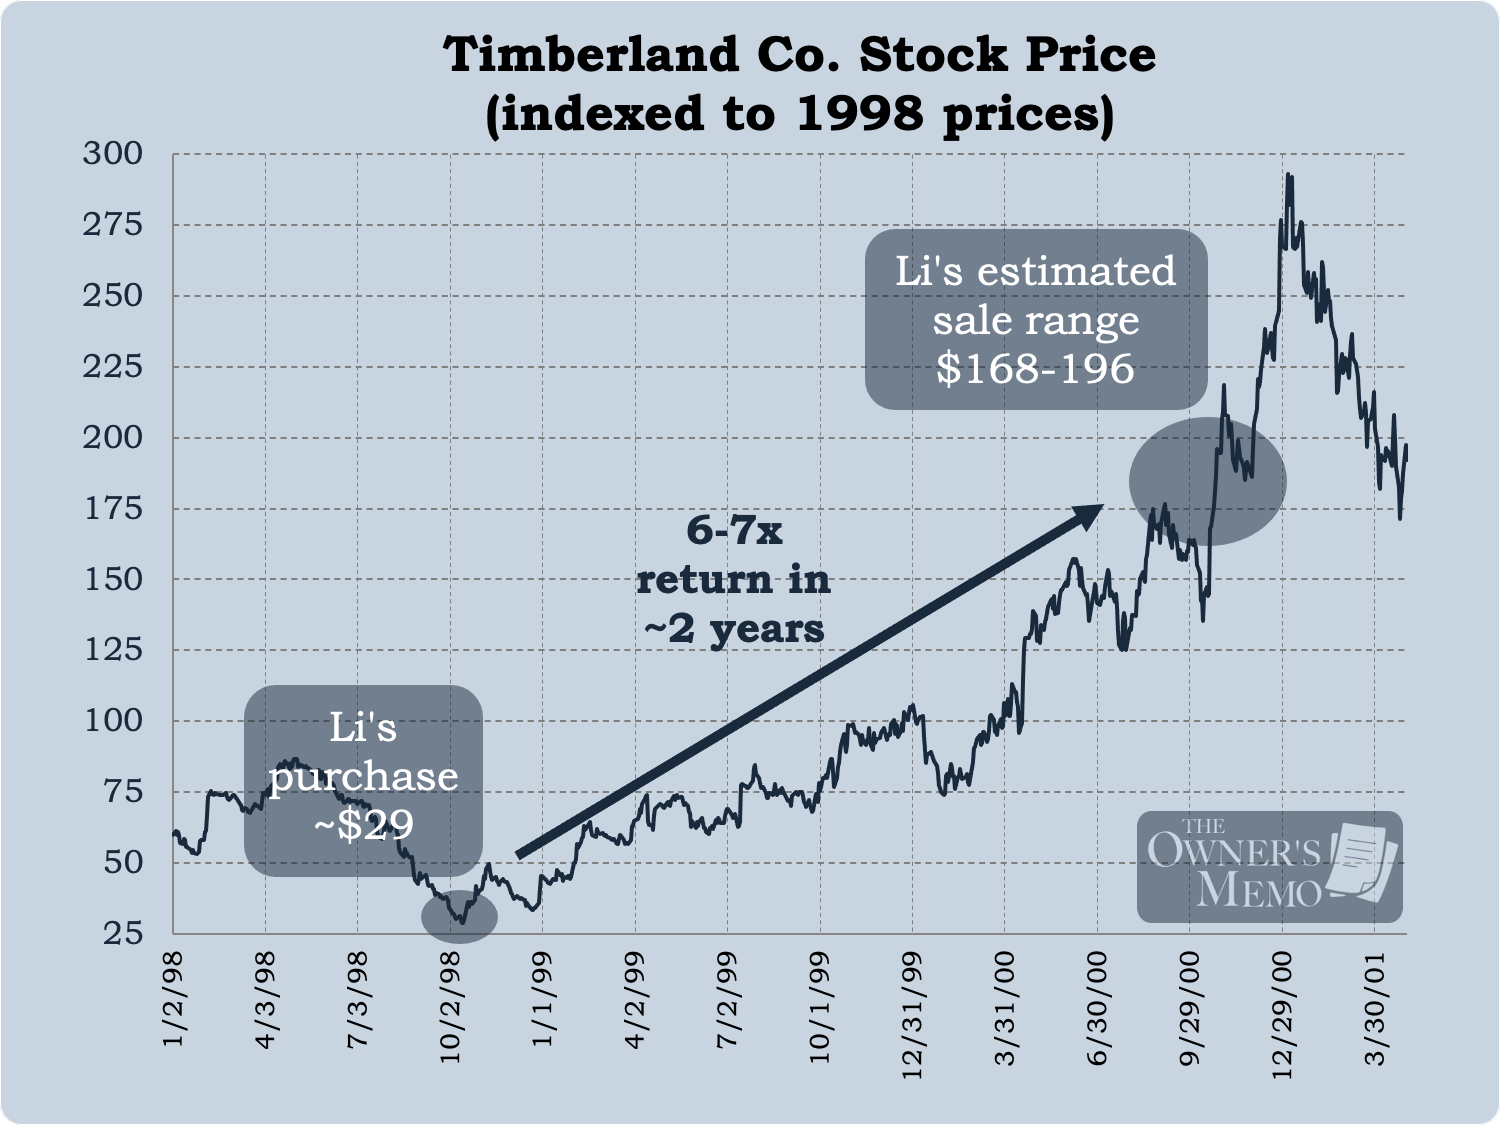
Although I don’t know the exact prices that Li bought and sold his position for, I can make some rough estimates. In Part Two of the case study, I show the rough times and prices for Li’s purchases and sales based on statements he made in his talk.
For the purposes of this exercise, I’ll assume:
Li made all his purchases at the real-time closing price of $29.00 per share on October 14, 1998, and
Li sold all his shares at the closing price of $181.00 per share on October 24, 20001.
These prices imply that Li made 6.2 times his money, in line with his stated “6 to 7 times”. It equates to a stunning 147% annualized return over the 2+ years.
With those two dates and prices in mind, let’s break down the above five factors. Like any good case study, it will be important to only use information available at the time of Li’s purchases and sales, so we will use the trailing twelve months of financial data available as of the two dates.
Dividends
First off, Timberland did not pay any dividends over the period of time Li held the stock, so we can dispense with that factor. What about the rest?
Earnings per share
In October of 1998, Li would have had financial information on Timberland from the company’s Q2 1998 10-Q (filed on August 7), and in October of 2000, he would have had the Q2 2000 10-Q (filed on August 11). The table below shows the trailing twelve months of revenue, net income, share count, and net income per share.
Price-to-earnings multiple
Based on the trailing twelve months of financial information Li would have known at the time and the prices he would have seen in the market, he would have been buying Timberland at a P/E ratio of 6.6 and he would have been selling it at 22.3.
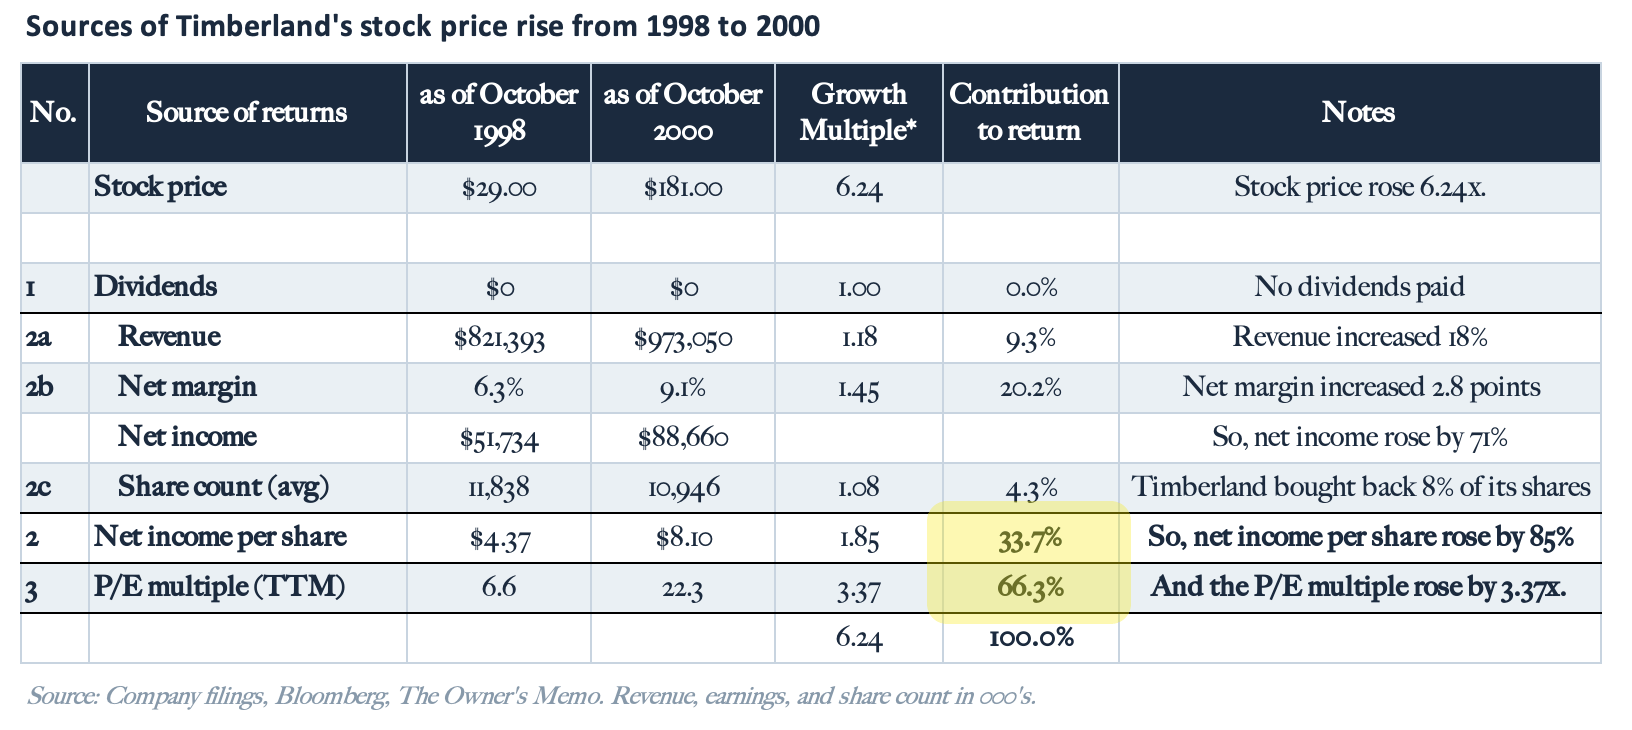
The columns above require a moment of explanation.
The columns labeled “as of October” show each metric either at the time Li made his purchase or for the trailing twelve months, as he would have known them to be2.
“Growth multiple” shows how much each driver increased as a multiple, which we can think about, in turn, as driving the stock price. For example, revenue rose by 1.18x (an increase of 18%)3.
“Contribution to return” shows the relative magnitude of each driver of Timberland’s total return4.
Ok, so what?
The results paint an interesting deeper picture for what happened as Li made 6.2x his money on Timberland in just two years.
Entries #2 and #3 in the table above show the big takeaway:
Two-thirds of Li’s return came from the price-to-earnings multiple on the stock expanding from 6.6 to 22.3.
One-third of his returns came from improvements in the business leading to higher earnings.
Of this 33%, 20 points of it was due to improvements in net margin, that is, Timberland running a better business.
9 points was due to revenue increasing, Timberland selling more merchandise.
4 points was due to the company buying back shares.
This may be surprising at first; Li made most of his money just because the market was willing to pay a higher multiple for the stock! But it makes some sense if you think it through.
Three kinds of good investments: A framework
Bogle and Nolan’s 2015 paper, Occam’s Razor Redux, which talks about return attributions like the one above for the broad equity market, has an interesting chart in it.
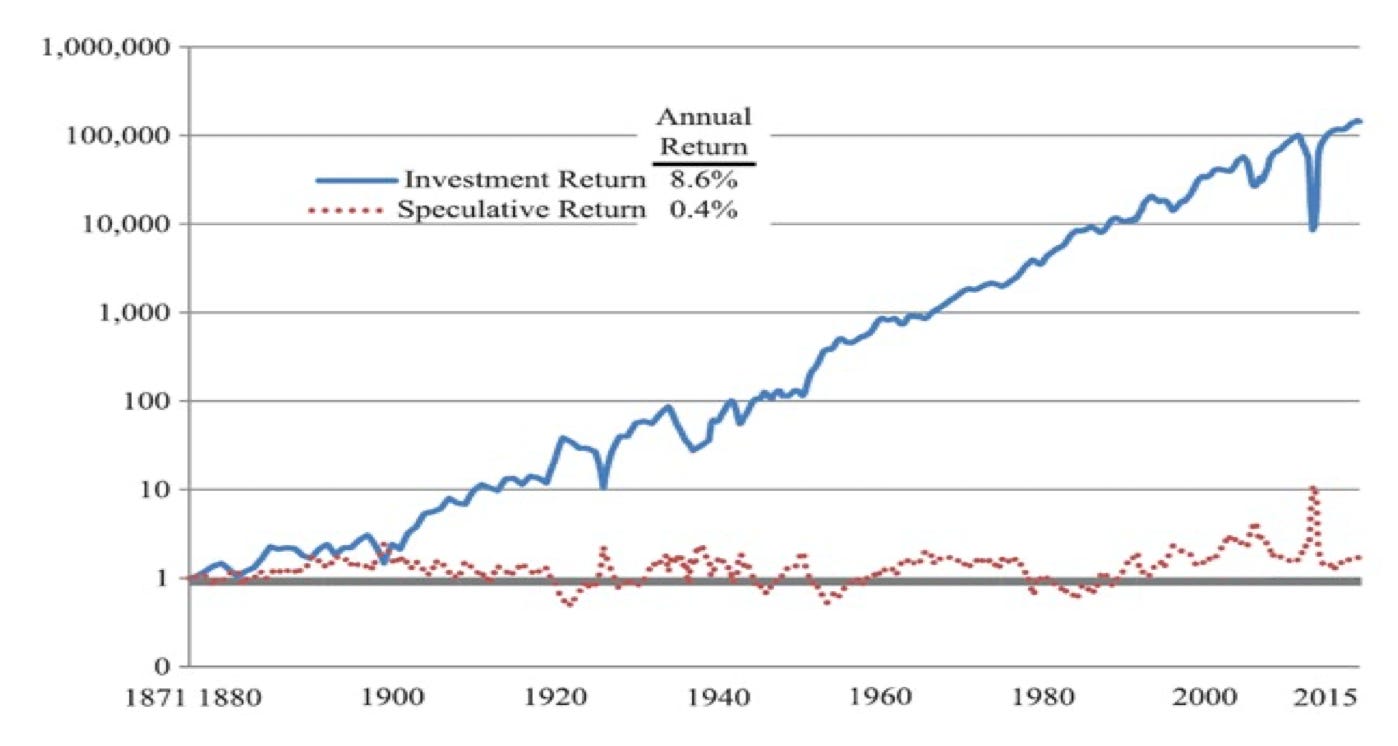
The chart shows returns for the S&P 500 broken into “Investment Return” and “Speculative Return”.
Investment Return (blue line) is equivalent to what we showed above in entries #1 and #2. It is those returns that an investor can earn by (1) receiving dividends and (2) from earnings at the company going up.
Speculative Return (red line), on the other hand, is equivalent to #3: the return that might come from the market paying a higher multiple.
The chart’s message is simple: over very long periods of time, investors cannot count much on earning their returns from expanding multiples. Rather, virtually all the returns earned by equity investors have come from underlying businesses doing better and better.
1) The great business at a great price
Now, Li’s return, as we mentioned, came 2/3 from multiple expansion and 1/3 from earnings increasing. Finding investments like this is very hard, but, when they can be found, they can be incredible. To paraphrase Buffett, those are the pitches I should be waiting to swing at.
By buying a good company at a low valuation, whose earnings Li felt comfortable would continue to improve, he was able to generate 6.2 times his money over only two years, for a stratospheric annualized return of 147%.
Note, too, however, that Li’s investment did not last very long. Often, the companies that can be found at low P/E ratios are not the very best companies that can be owned for 20 years or more. Instead, they are typically either outright bad businesses or merely good businesses being misunderstood. (Timberland, being a good company, albeit in the challenging clothing and fashion industry, was in the latter bucket.)
So, investments like Li’s can be excellent, but once in a blue moon, the market hands you a similar investment opportunity that can be even better: those truly great businesses that are temporarily trading at a low multiple.
Microsoft
The example that jumps to my mind here is Microsoft back around the year 2010. The stock was trading at a P/E multiple of 8.2 (a earnings yield of 12.2%), and revenues and earnings had grown by 57% and 53% respectively over the past five years. Microsoft’s competitive position, with Windows and Office, was still very strong, but investors were tired of the stock underperforming for years after it peaked in the dot-com boom and crash and had yet to eclipse those price levels. At the time, there were also questions about how the company could grow in the future.
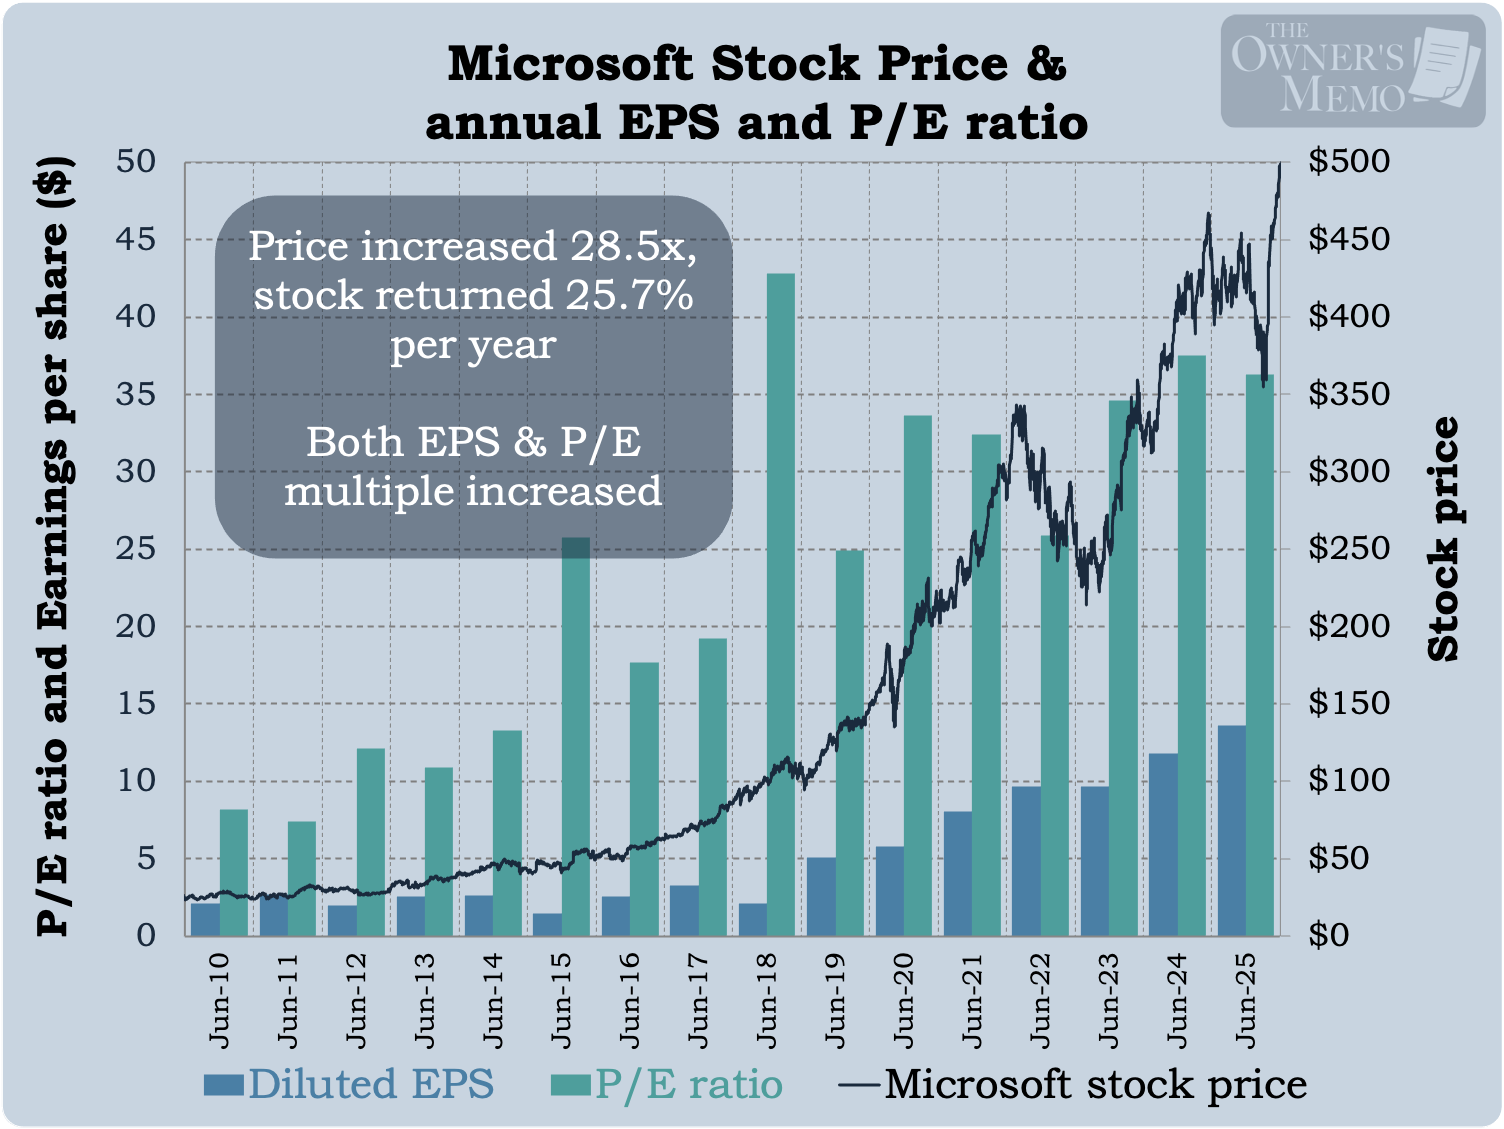
Over the subsequent 15 years through 2025, Microsoft’s earnings per share increased from $2.10 to $13.64, and its P/E multiple increased from 8.2 to 36.3.
Running the same return analysis as we did for Timberland shows a very even split for Microsoft’s returns: 56% of the returns were due to earnings per share having risen and 44% due to the P/E multiple having risen. Microsoft is similar to Timberland in that regard, but with one big difference: the quality of Microsoft’s business is and was much better than Timberland’s, as evidenced by its earnings rising for a very long period of time.
Over the course of 15 years, and as a result of both tailwinds, Microsoft returned 25.7% per year and its stock rose by 28.5 times. (Microsoft also paid its shareholders a dividend over that time, which contributed 0.7 percentage points to the 25.7%.)
Investments like this are rare, but when they can be found, they can represent once- (or few-) in-a-lifetime opportunities.
2) The great business at a fair price
What about those investments for which earnings increases alone are the driver? These investments, too, can be very good, albeit not at the stratospheric levels of the investments mentioned above. On the other hand, they can often persist for very long periods.
These investments are the purchases of “great businesses at fair prices” as Buffett likes to say.
AutoZone is one such investment. The auto parts retailer has produced fantastic returns across virtually its entire history as a public company.
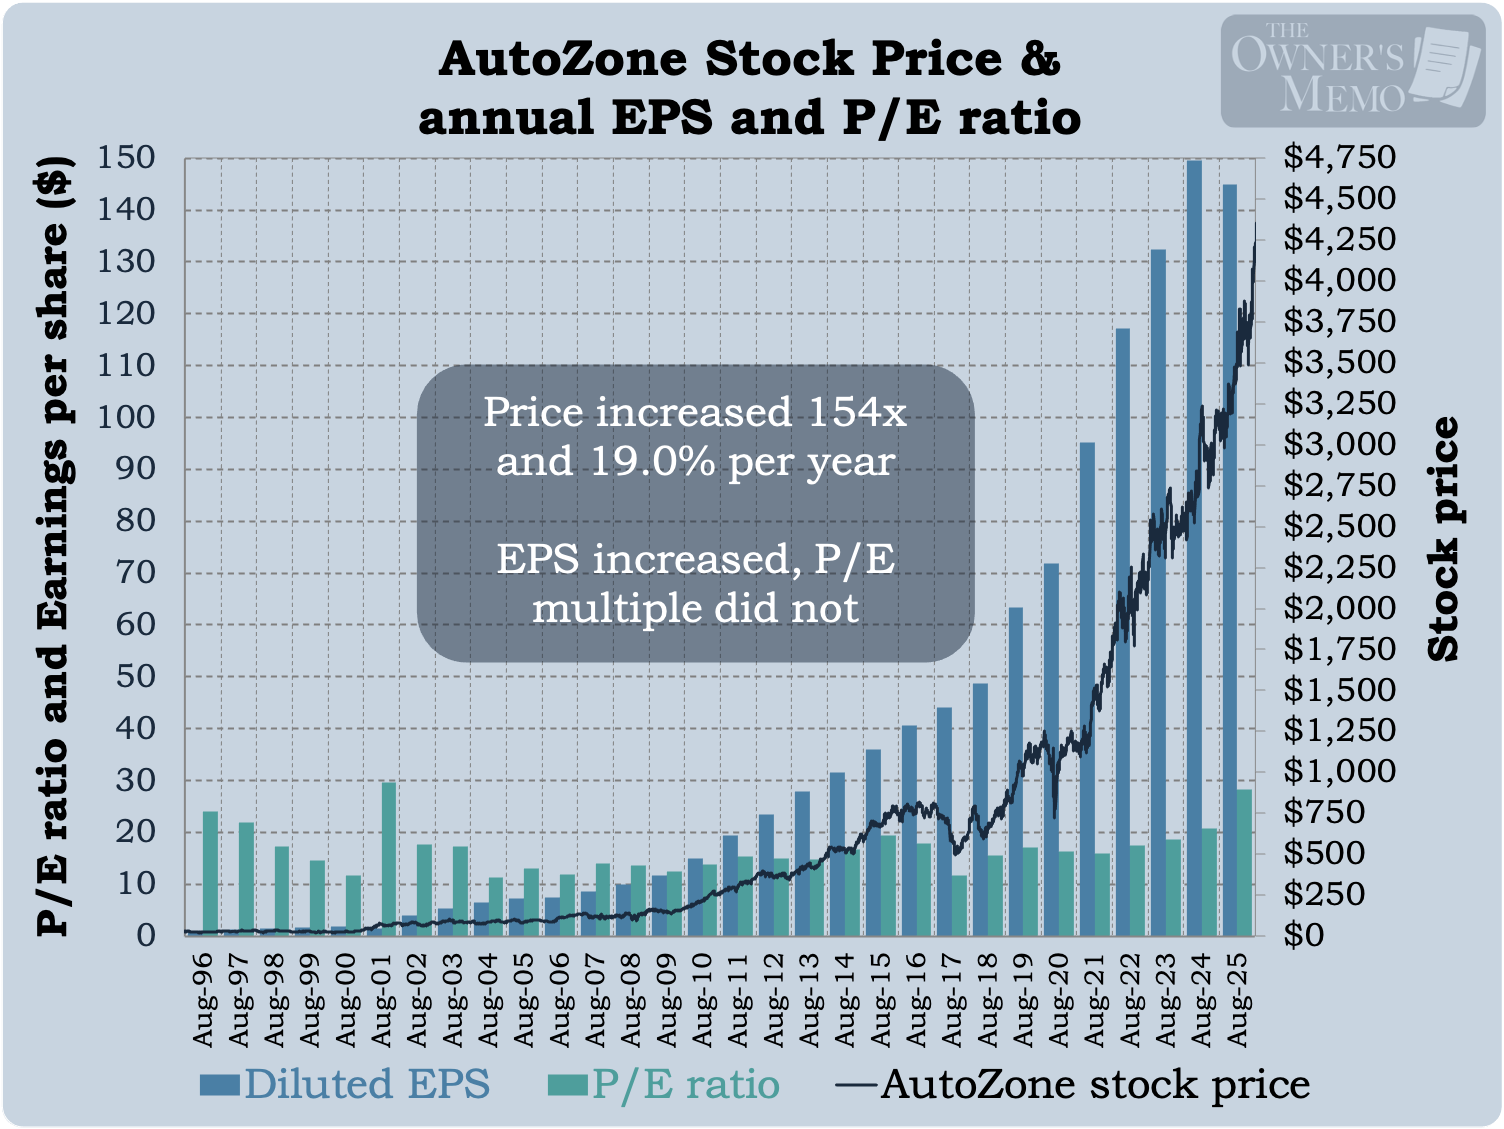
For example, from fiscal year-end 1996 to 2025, the company increased earnings per share from $1.11 to $144.87 and its stock increased in price from $27.25 to $4,198, a return of 154 times, or 19.0% per year.
At the start of that run, the P/E multiple for AutoZone was 24.1 and at the end, it was nearly the same, at 28.2.
It’s easy to see that a return analysis for AutoZone shows just about all of the returns on the stock, 97% of them in fact, were due to earnings per share marching up over time (the blue bars in the chart above). The tiny remainder were due to a slightly higher multiple.
There are two things to say about this.
First, although investments in this category can be great if the business is great, they do not rise to the highest heights like those rare purchases of great business at great prices, like Microsoft.
Second, maybe I’m nitpicking a bit with that statement. An investment in AutoZone over the past 29 years could have made anyone very rich simply by buying it and holding on for the ride. Finding a great business, buying it, and holding on, is a great way for an investor to compound his or her money and sleep well at night, even if the purchase was made at what seems to be a high P/E ratio.
3) The fair business at a great price
This category is the most difficult to navigate. There are occasionally some really great bargains that can be had in companies that are not generally increasing their earnings but which the market has punished to an unfair degree.
Take the company Dillard’s, for example. Dillard’s is an apparel and home furnishing retailer with stores in 30 US states. Texas and Florida are their biggest markets.
In fiscal 2021, Dillard’s sold about $6.6 billion worth of merchandise, an amount lower than the $8.6 billion it had sold way back in the year 2000. To say the company was viewed as stagnating would be an understatement.
As a result, and in part due to large disruptions during the COVID-19 pandemic, the stock was trading at a price of just 253.72 at the end of fiscal 2021 and had earned $41.87 per share for the year, for a P/E ratio of 6.1. That’s an earnings yield of 16.4% for a company that, while it wasn’t growing, was in fact doing steady business.
By the end of fiscal 2025 (January 2026), the stock was trading at a price of $607.56 on earnings for the year of $36.42, an amount less than it made four years ago. The P/E ratio of the stock had risen to 16.7.
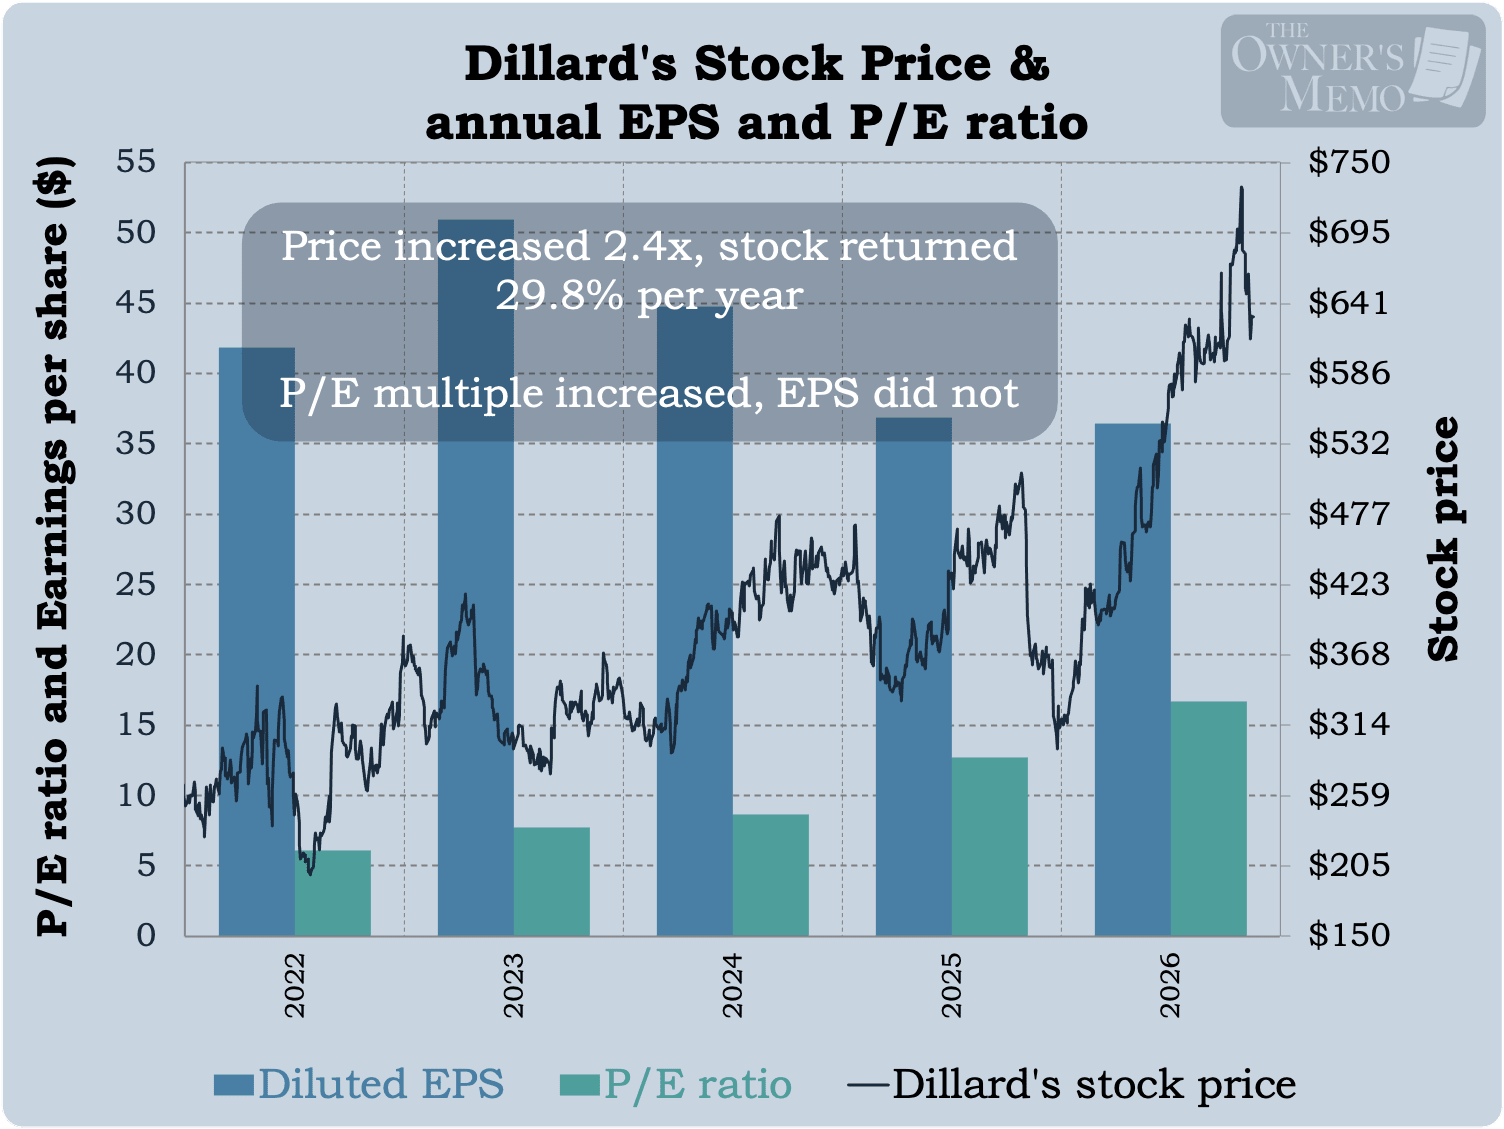
During the period, Dillard’s stock price rose by 2.4 times, and it generated a large annualized return of 29.8%5.
The result is great, but the numbers need to be caveated with the following warning: Returns like these come with much more work than buying businesses like AutoZone or Microsoft that are more difficult to disrupt.
It’s not enough to simply buy Dillard’s because the P/E ratio was low. I would need to become as comfortable as possible that Dillard’s position wasn’t getting materially worse. And that’s easier said than done. I’d read everything I could on the company, including not just the company’s financial reports but also industry trade journals, listen to earnings calls, and even visit some stores to get a sense for whether things were changing on the ground.
But assuming I could get comfortable with it, then a low P/E is a good thing, especially when combined with the catalysts of share buybacks and dividend payments, both of which Dillard’s management team was doing. Catalysts, including the return of capital to shareholders, can be very reassuring when a stock is priced as cheaply as Dillard’s was.
Over the four years from January 2022 to January 2026, the Dillard’s management team bought back 24% of their outstanding stock, taking the share count from 20.6 million to 15.7 million, and returned an additional $93 per share to shareholders in the form of dividends.
When capital is flowing back to shareholders in such volume, allowing shareholders to realize their 16.4% earnings yield in the form of cash or a larger ownership position in the company, it’s easier to get comfortable that the price will rise as new shareholder see the attraction and bid up the stock.
One final thing to note about these types of investments (P/E multiple expansion in a stagnant business) is that the investments typically don’t last longer than a few years. Recall the chart I showed at the beginning of the article from Bogle and Nolan: “Speculative returns”, that is, multiple expansions, don’t tend to persist for the long term. Once the multiple rises enough, I need to remember not to fall in love with the business.
These prices are unadjusted for two 2-for-1 stock splits, and, as such, correctly account for Li’s returns if we assume he held the same number of shares throughout.
Timberland had two 2-for-1 stock splits between October 14, 1998 and October 24, 2000. The data in the chart is adjusted as if those splits never happened. In that way, the table shows the true performance of each of the metrics shown.
Revenue rose by a factor of 1.18, margins expanded by a factor of 1.45, and the company’s share count fell by 8% (boosting earnings per share). The price-to-earnings multiple expanded by a factor of 3.37. Multiply (1)x(2)x(3) or multiply (1)x(2a)x(2b)x(2c)x(3) together and you get 6.24, which matches the total return Li made on his investment.
For those statisticians among you, the percentage in the column shows each contribution as a percentage of the total log return, which is the most common way return attributions are reported in the academic literature.
The appreciation in Dillard’s stock price amounted to a 24.4% annualized return and Dillard’s also paid some significant dividends that increased the return by 5.4 percentage points for a total of 29.8% per year.
Loved this series Tim !!!
You didn’t just retell Li Lu’s Timberland story — you helped readers travel back to 1998 and feel the uncertainty of that moment.
The old Value Line pages, filings, charts, news context, and return-engine breakdown made the case come alive beautifully.
My biggest takeaway: great investing is not just finding cheap stocks. It is understanding Why they are cheap, whether the fear is real or overdone, and which return engine will actually pay you.
Really grateful you put this together.