


In Part 1 of this three-part series, I examined Michael Mauboussin and Dan Callahan’s work on Return on Invested Capital and suggested Indivior Pharmaceuticals could be an interesting investment to consider as a result.
In Part 2, I dug into more companies from the study, those on the frontier of ROIC, and discussed Clear Secure as another interesting and potentially undervalued stock.
Part 3 continues the work and reveals two more companies that fit a surprising observation the authors made.
As a brief recap of Parts 1 and 2 of this work, Mauboussin and Callahan break a company’s return on invested capital into its operating margin (how much revenue the company can “keep”) and its invested capital turnover (how much and how quickly the company can sell stuff).

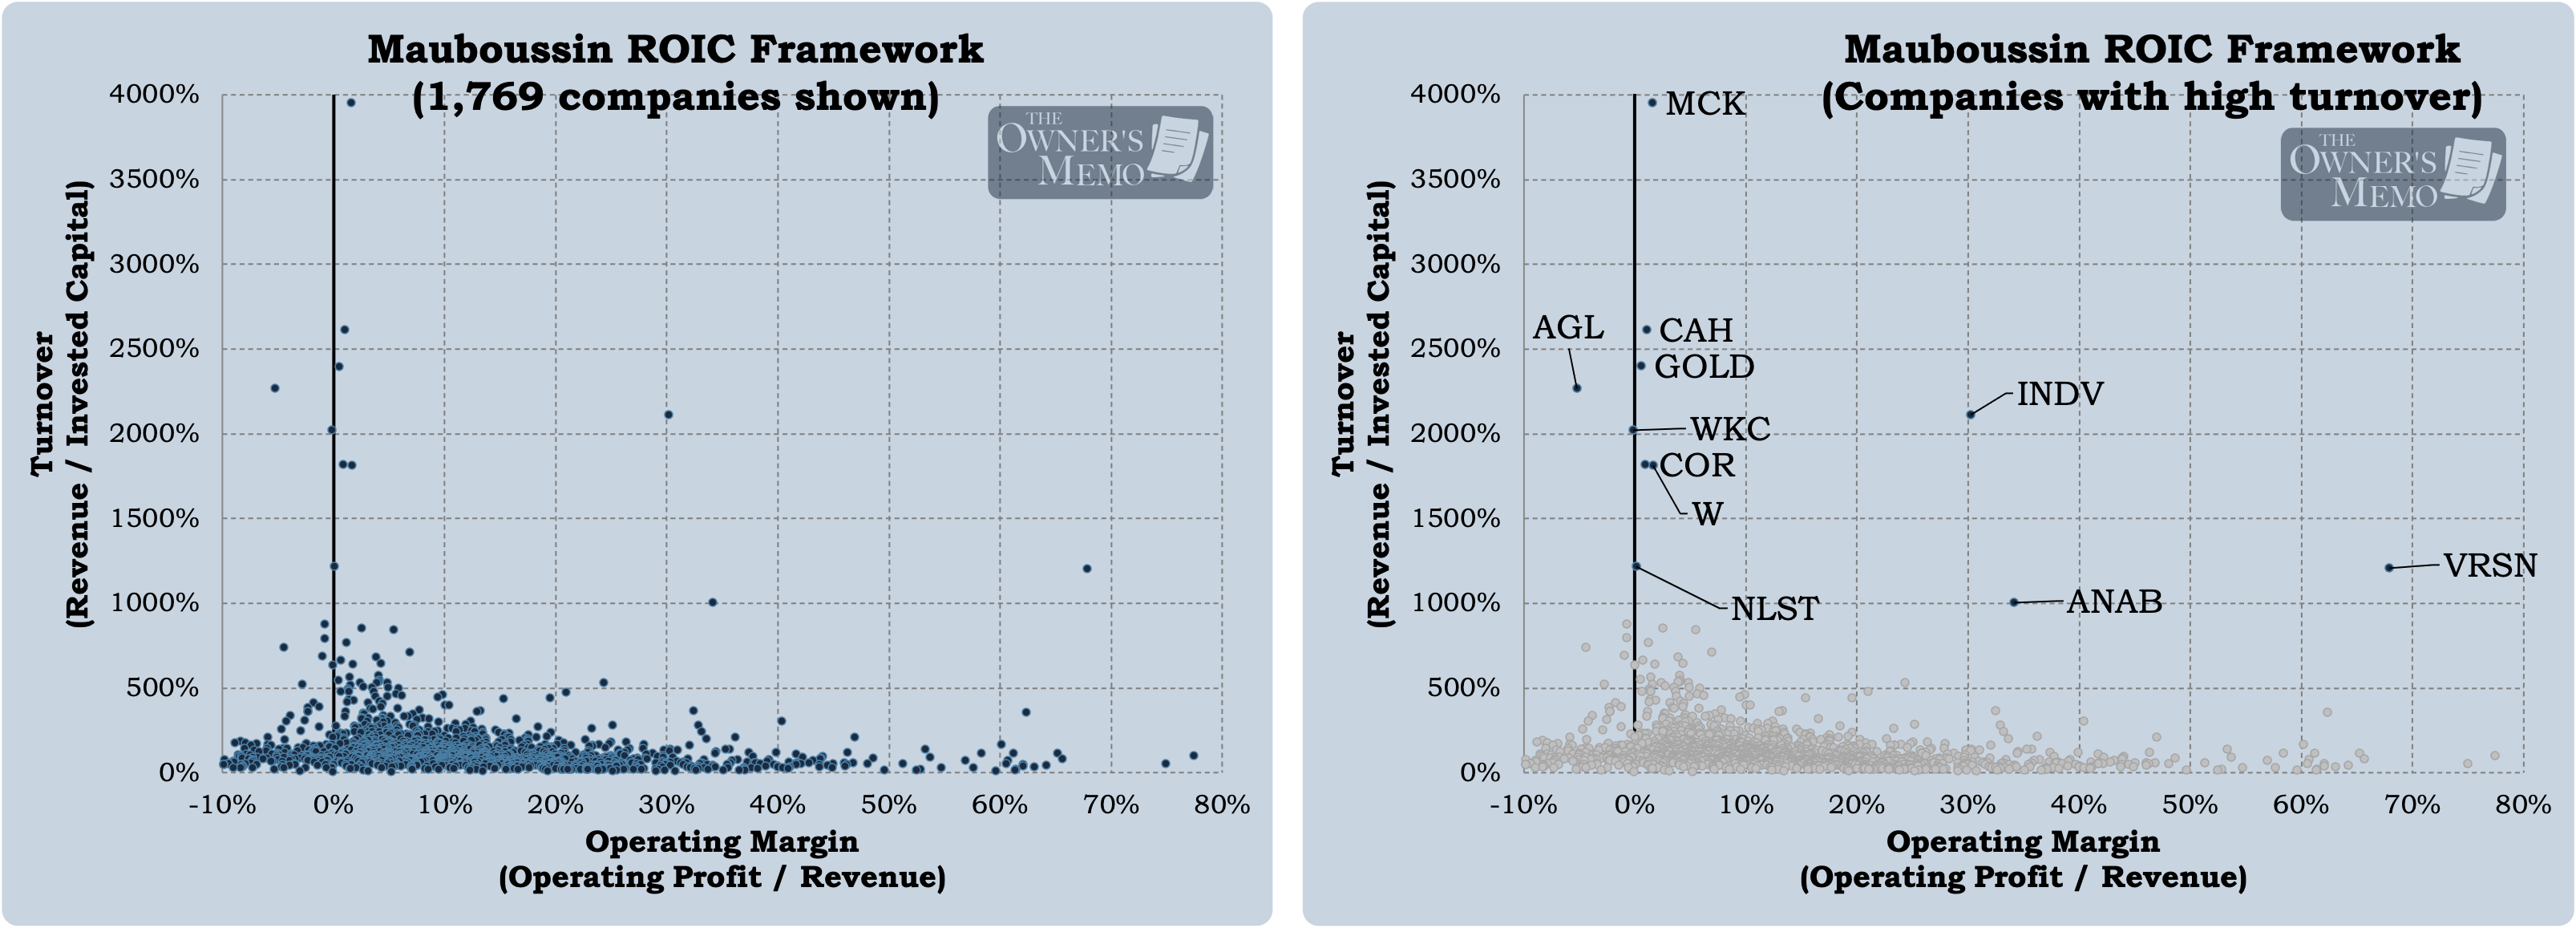
I discussed how Mauboussin and Callahan show each of the top 500 companies in the Russell 3000 as a dot on a chart plotting these two terms using 2022 data. In Part 1, I updated the chart to widen the scope to 1,769 companies with data from the trailing twelve months.
The updated chart is below, along with a view that highlights the companies with the highest invested capital turnover, from which we discovered Indivior Pharmaceuticals, a company with very high operating margins currently seeking to undergo a merger. See Part 1 for more.
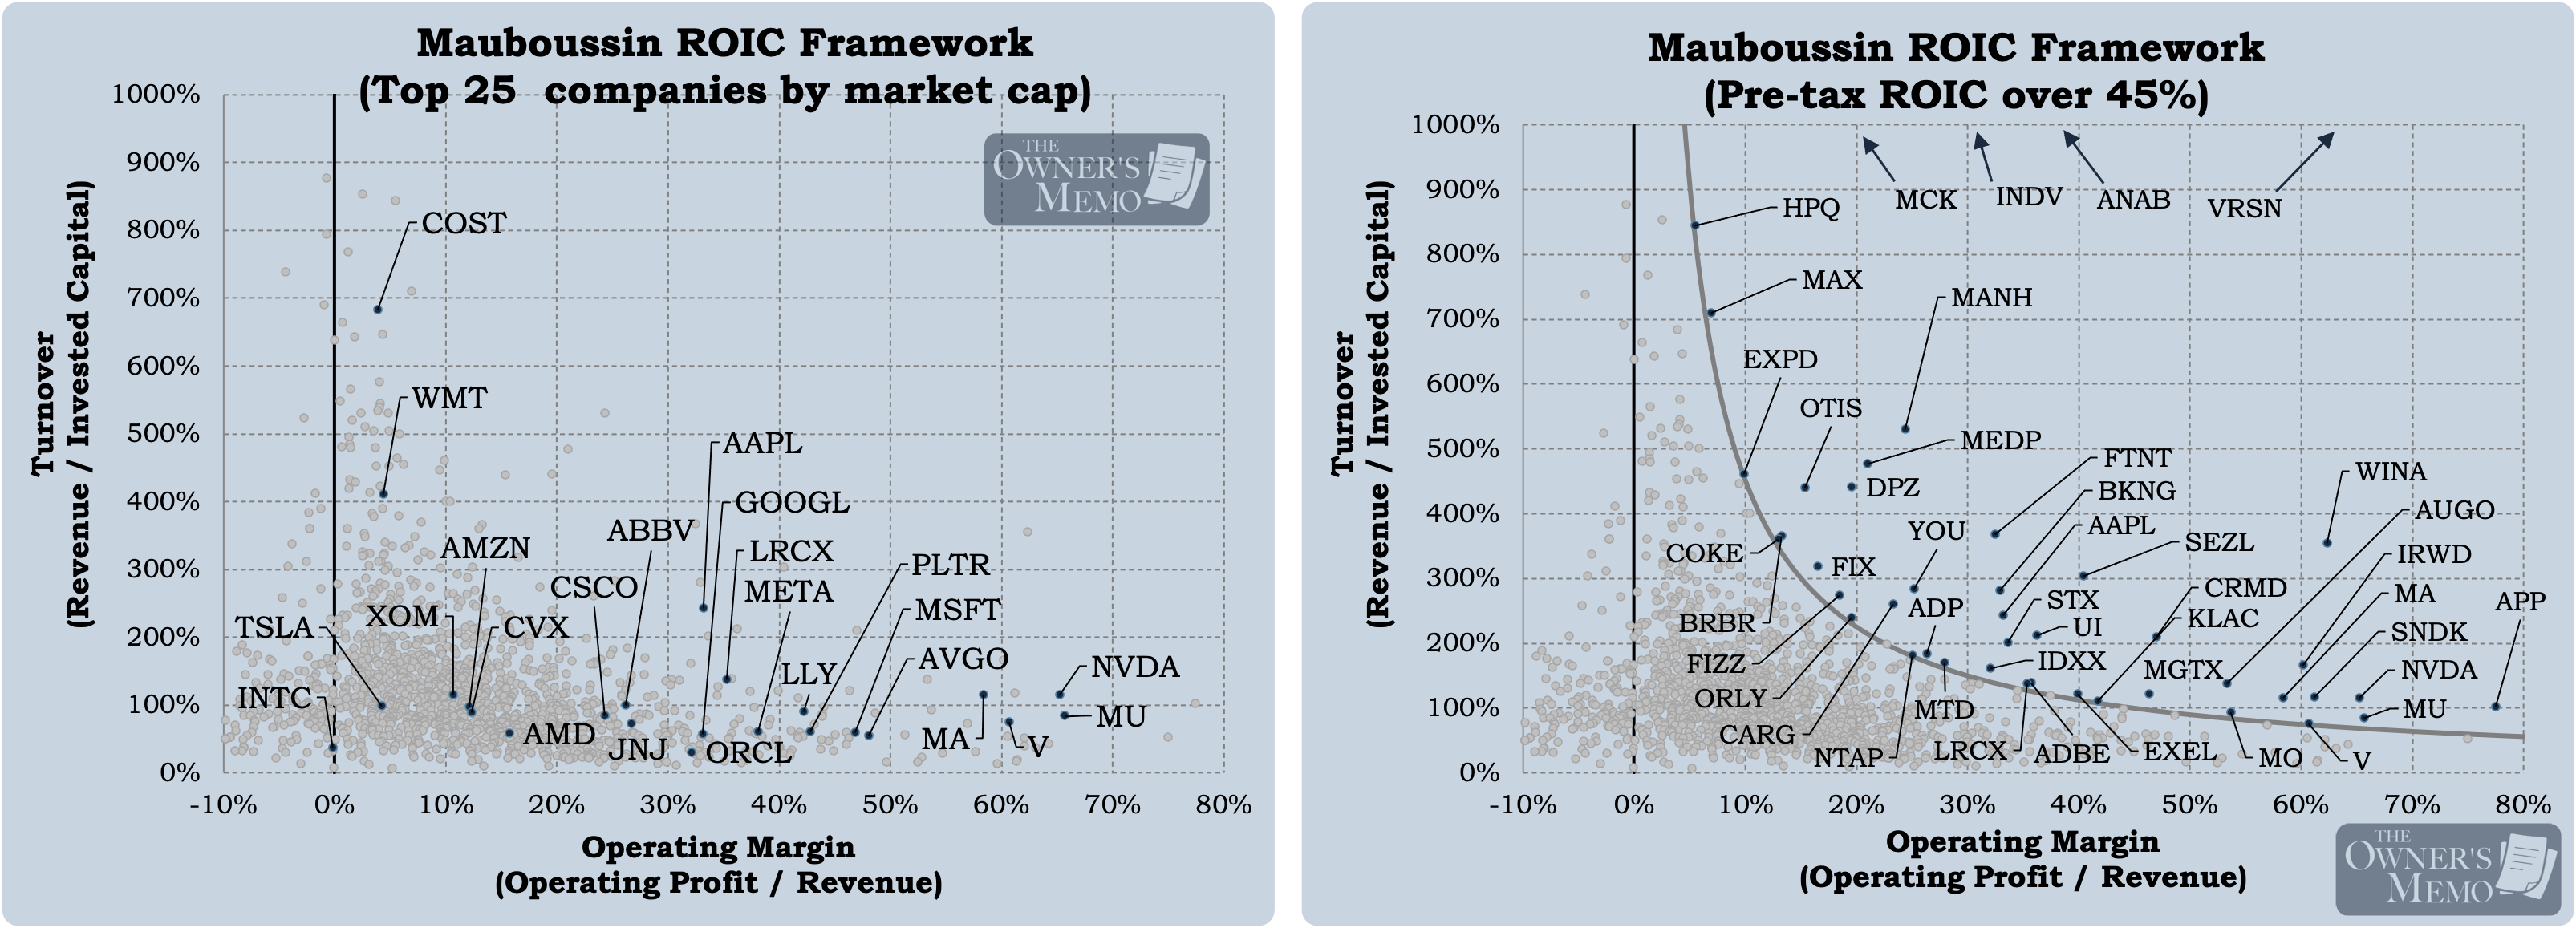
Then, I continued examining the ROIC data in detail by looking at the top 25 companies by market cap and all companies regardless of market cap that were at the frontier, with pre-tax ROICs above 45%. Those charts are below. From that work, we discovered and discussed Clear Secure, Inc., a company with high growth, high and growing operating margins, and a potential undervaluation. See Part 2 for more on that.
Now, let’s focus on another aspect of Mauboussin and Callahan’s work that I think is even more interesting than their ROIC breakdown. It is work that’s not discussed nearly as much.
A Good Company Today ≠ A Good Stock Tomorrow
In their 2023 piece, ROIC and the Investment Process, the authors make the simple but important point that a good company (with a high ROIC) is not the same as a good stock (that generates high returns for the investor):
A good company, which has a high ROIC, and a good stock, which has a high total shareholder return (TSR), are two different things. The reason is that a stock price reflects the market’s expectations about a company’s future financial results. Excess returns are the result of revisions in expectations.
They then show the following table, which highlights the annualized three-year returns for companies over the 1990-2022 timeframe, depending on which quintile of ROIC they started from and ended with.
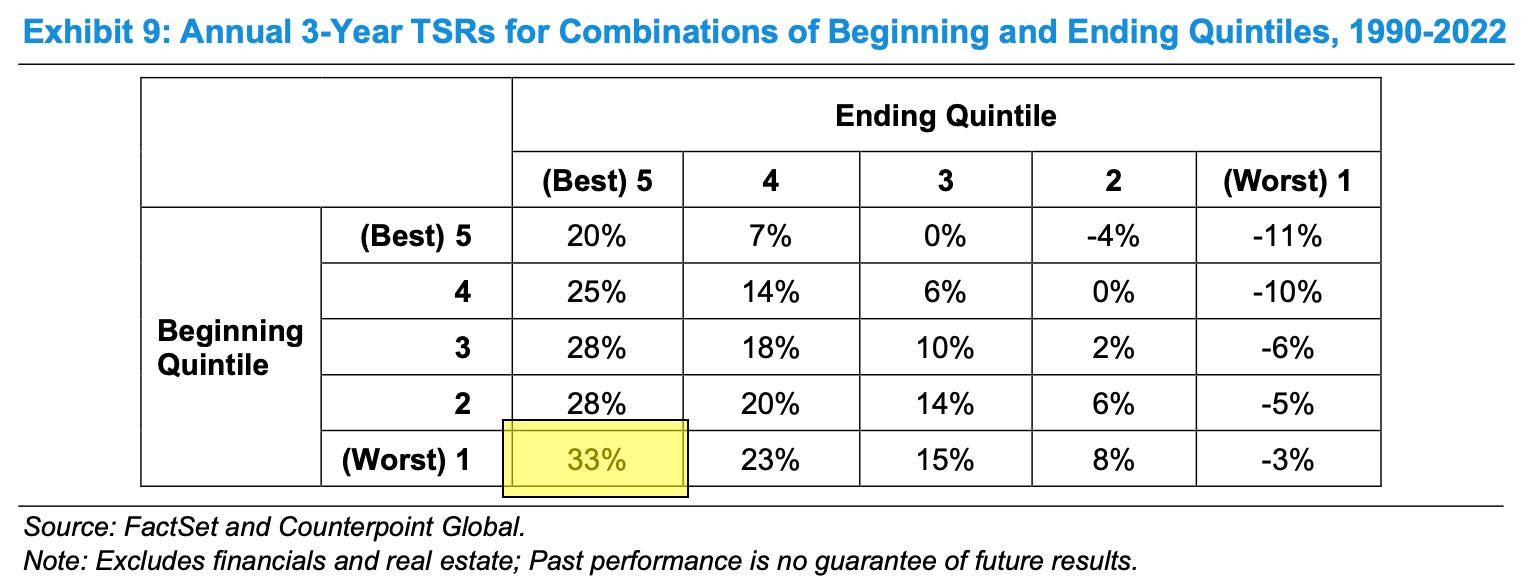
For example, take a look at the box I highlighted. A company that started a three-year period among the worst ROIC levels but which migrated over three years to being in the best quintile returned, on average, 33% per year from its stock.
The table above is fascinating, and it tells us a few things that are intuitive to an experienced investor, namely that:
the companies that have the worst ROICs but then improve should provide pretty great returns for those investors who were able to see that at the start,
the companies that end up in the best ROIC quintile, no matter where they started, should also produce pretty great returns, and
the companies that start with the best ROICs and fall from grace should produce very poor returns.
From this table, it seems pretty obvious that an investor could generally earn great returns by sticking with companies that had the highest ROICs, provided the companies could remain at the top. Many investors try to do just that, of course, and perform extensive diligence to ensure as best as possible that their companies will remain dominant, that their economic moats will remain strong over long periods.
Finding the ROIC Improvers
But there is another strategy to explore too. Instead of starting with the companies with the best ROICs, which are typically obvious and often richly priced, what if we focused on trying to find those companies that were starting off with low ROICs but that would migrate upward? We would be trying to find companies close to the highlighted box in Figure 3.
Great idea, Tim! Why, thank you.
Now, how could we do that? After all, such companies would not show up on a stock screen since they would have low ROICs today and would look the same as any other low-earning company.
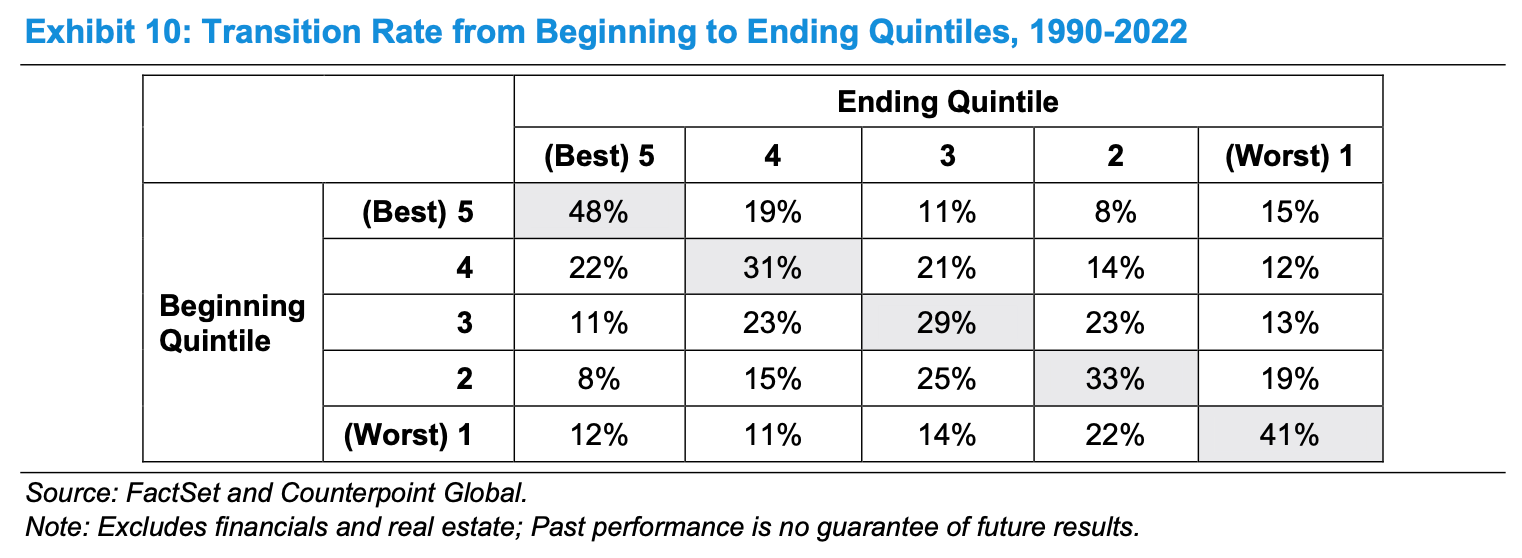
Moreover, the task is doubly difficult because, as Mauboussin and Callahan point out with a second table of data, the most likely outcome for a company in any given ROIC quintile is to remain in that quintile. It’s not easy to find great companies that are underearning today and are about to change.
Yet despite the difficulty, I had a thought. What if we could screen for those companies that were among the lower ROIC companies today (or recently) but that were already demonstrating some improvement, some evidence that they were migrating upward?
Then, I recalled a somewhat obscure passage near the end of Mauboussin and Callahan’s paper:
We also examined whether differentiation or cost leadership was more represented among the firms that delivered high and sustained ROICs. We set a high bar by identifying only those companies that had ROICs in the top quintile for ten straight years over the span of 1990 to 2022. There were 469 occurrences in total, with some companies appearing multiple times. We then studied whether high NOPAT margins, or high invested capital turnover, distinguished the companies from the pack (see the appendix for details).
It turns out the companies are above the average overall in both drivers of ROIC, but the contribution of NOPAT margin was substantially more important.
In other words, if you had to select one of the two traits for a great company to have (high turnover “cost leadership” or high operating margin “differentiation”), high operating margins are the factor to prefer.
Now, we can make our screen a bit more precise. Instead of screening for those companies whose ROIC is growing, let’s attempt to find those companies whose operating margins were among the lowest but which have been improving over the recent past. Such a company would be benefitting from operating leverage via scale, pricing power, or otherwise. It would naturally have a rising ROIC as well, and it might “deliver high and sustained ROICs,” like the authors state.
Looking for Rising Operating Margins
Let’s start by splitting up our universe of companies. From the list of 1,769, I bucket their operating margins for the trailing twelve months into quintiles. The result is shown below.

After that, I added to the list the operating margin that each company achieved for the past six quarters, and I filtered the 1,769 companies down to those whose:
operating margins were in the worst or second-worst quintile eighteen months ago (i.e., below 5.2%), and
have increased every six months since then.
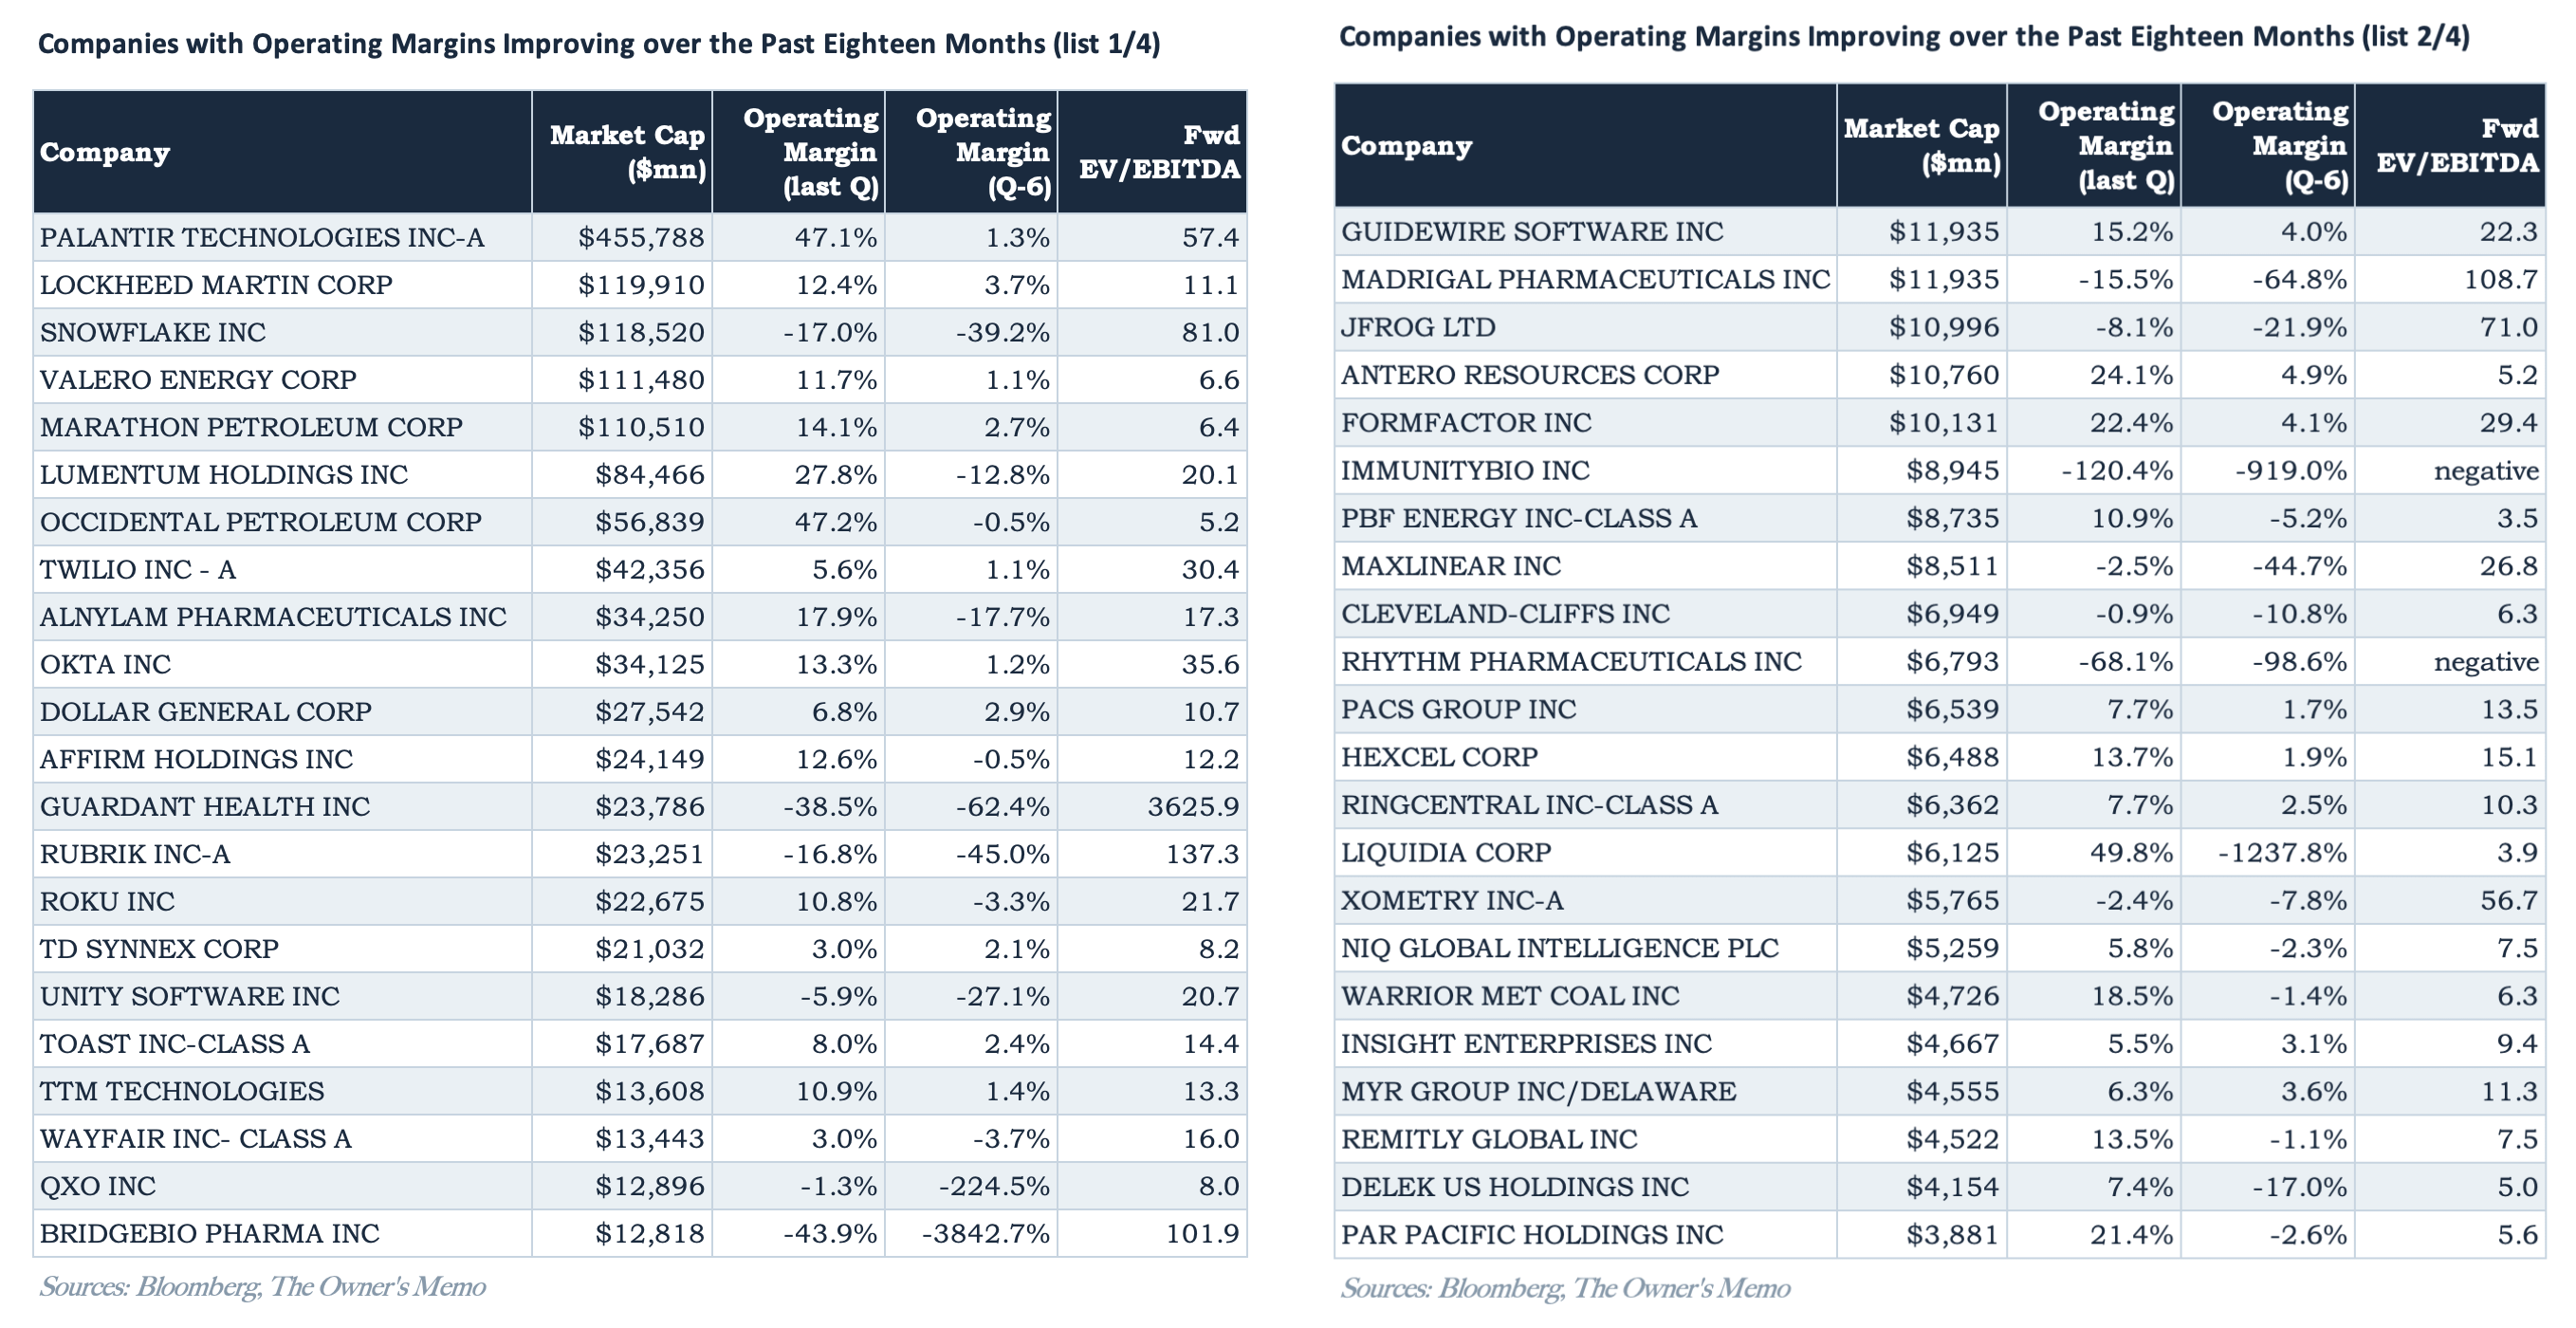
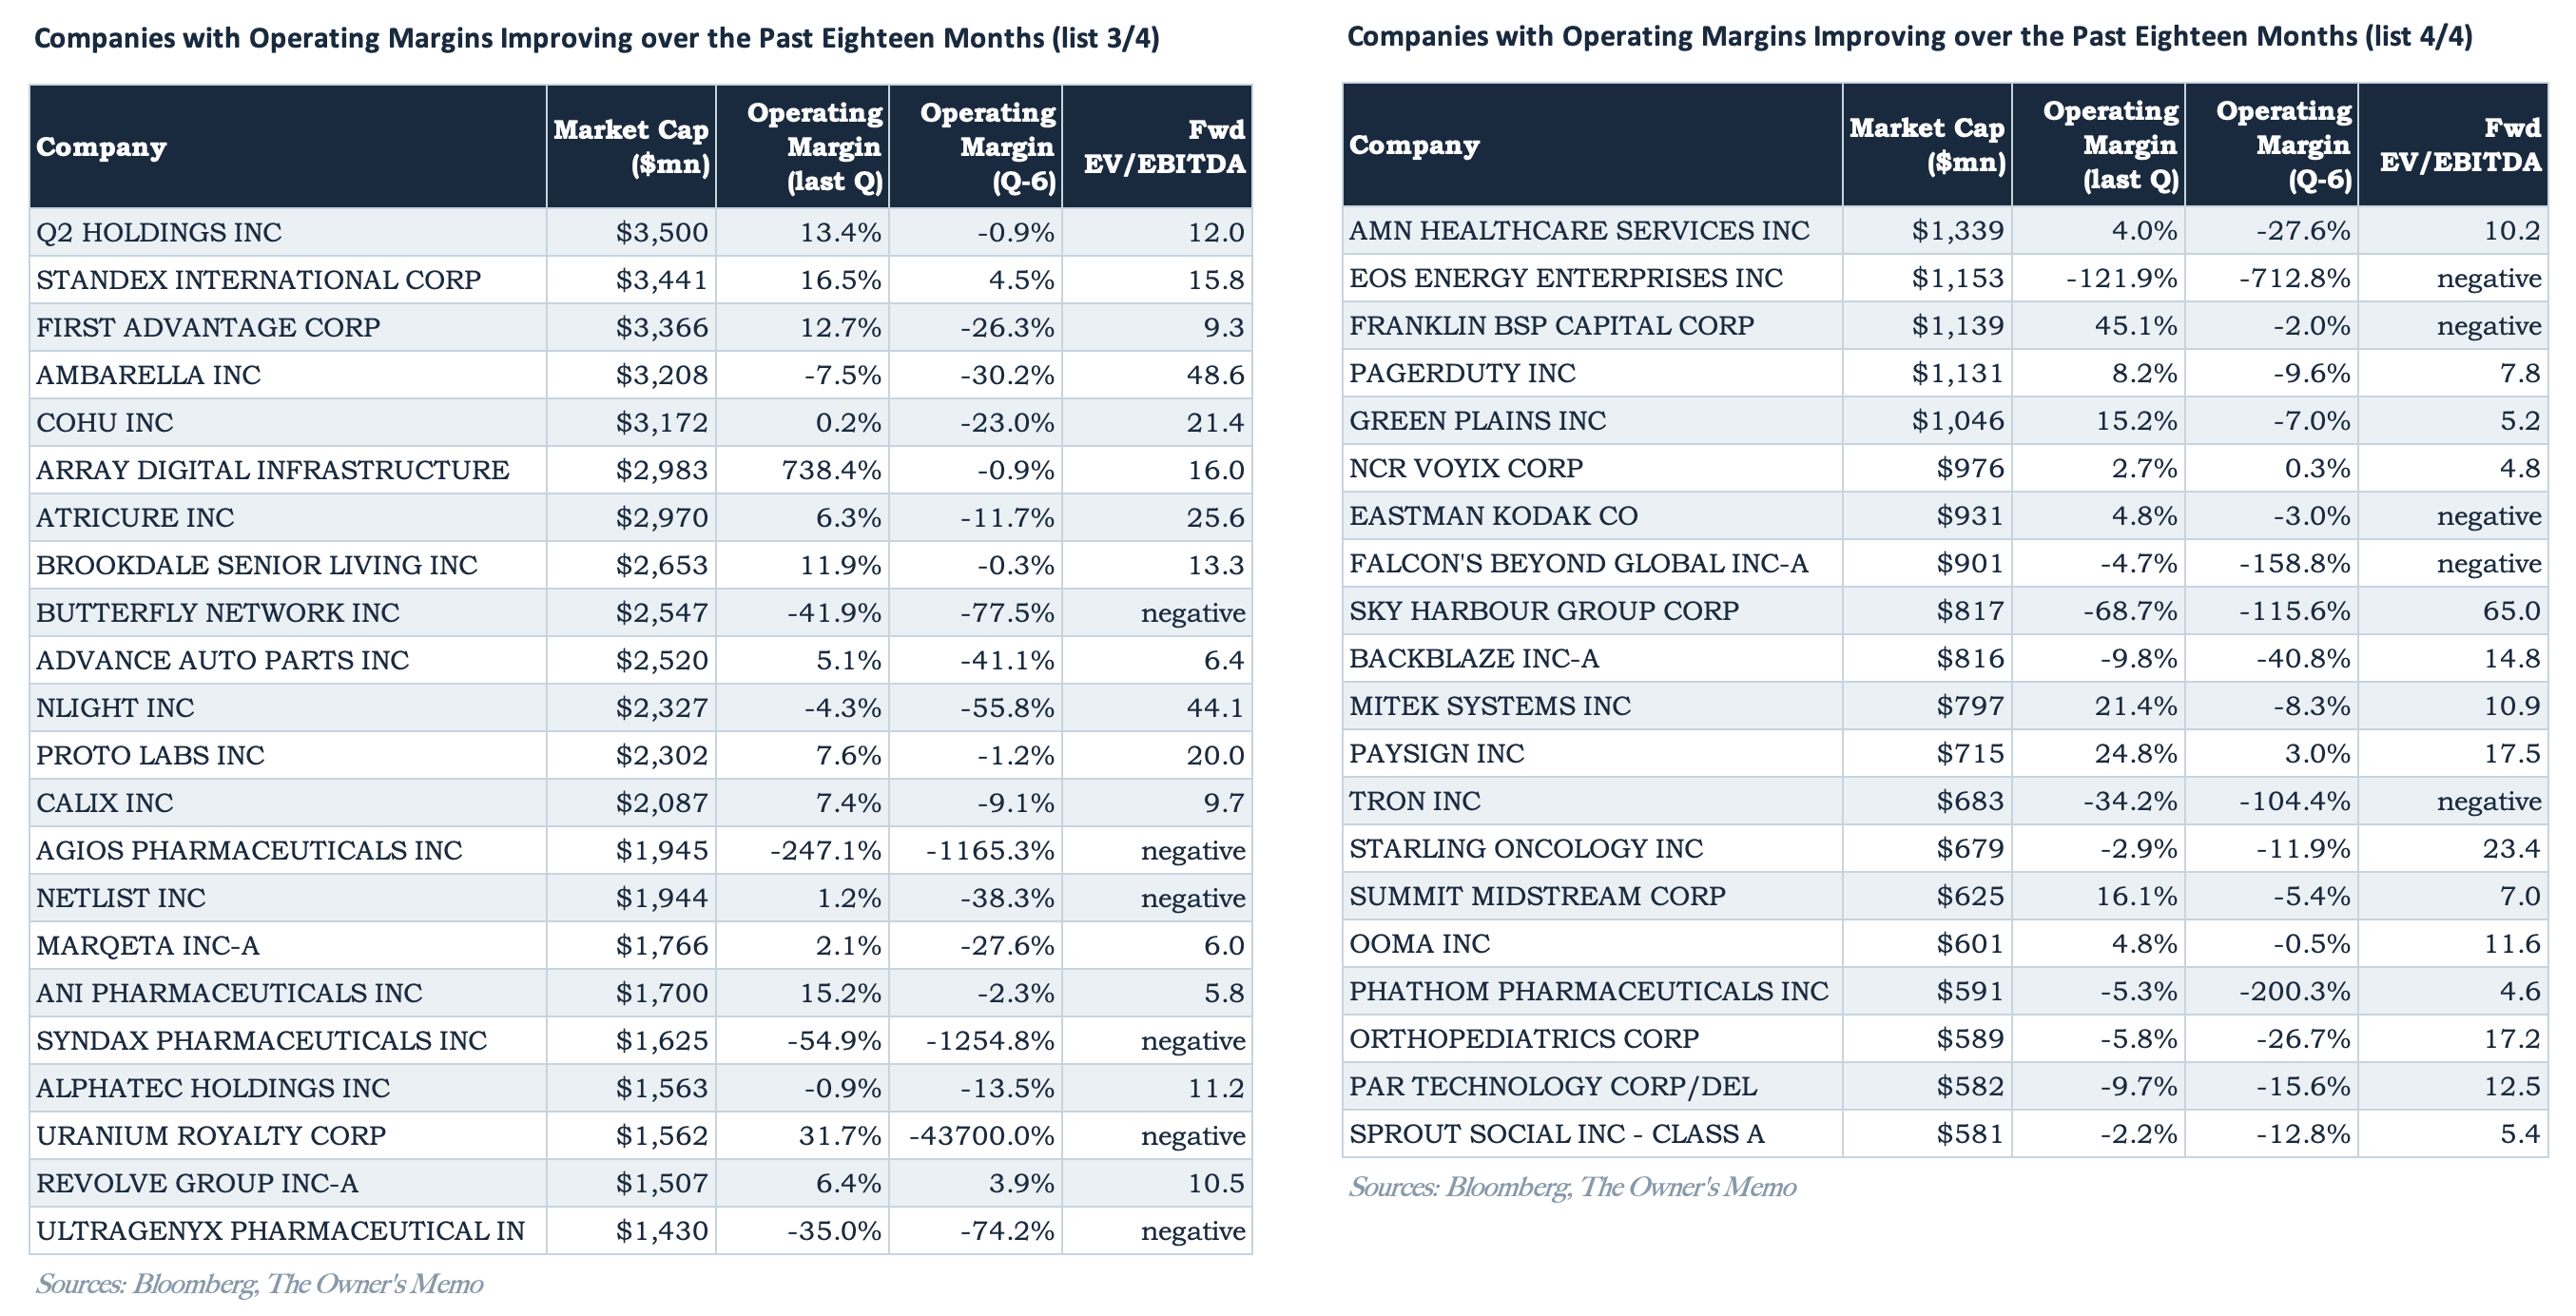
The resulting list has 86 companies on it, which provides a pretty good set of candidates to examine. It also reveals the way in which screening can be frustrating, of course. Sometimes, it produces more information than you would like, or it produces apparent false hits (for example, some of the names on the list have very negative operating margins that only got modestly better). Nevertheless, the full list is posted below for you to see.
For now, however, I will focus on two companies on the list that I have come across in the past and that I recall as being very intriguing. In retrospect, I am not surprised to see them on our list; they fit the mold we are looking for: good or great companies that are movin’ on up.
Remitly (ticker: RELY)
Remitly is a financial services provider known for the remittance service it has built since it was founded in 2011. It has a footprint in over 175 countries and 10.2 million active customers as of 2026 Q2. The company has grown remarkably over its life and since its IPO in September 2021.
It trades at a market cap of $5.17 billion and a per-share price of $24.43 as of October 19 with 211.7 million shares outstanding. The company produced operating income of $66.7 million in the most recent quarter, up from $14.6 million twelve months earlier.
I think of Remitly most succinctly as a “modern remittance” provider. The company enables its users to send money digitally to family and friends in other countries, via its mobile app, website, or by messaging services, and it also maintains the extensive network needed to get physical cash into customer hands when necessary. This is a business that older companies like Western Union and MoneyGram dominated in the past, and Remitly’s growth is evidence that it has done a good job modernizing the experience and disrupting the incumbents.
You can see the sizable growth in both Remitly’s active customer base and dollar send volume below, from their 2025 10-K:
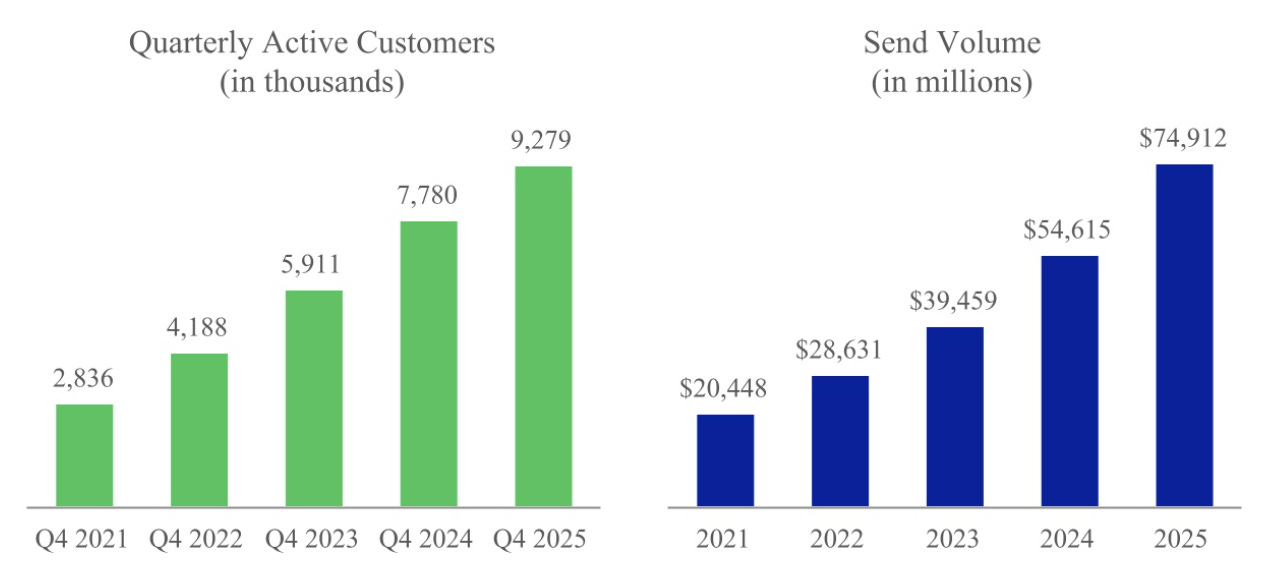
Remitly’s business is one that benefits well from economies of scale and, to some degree, from network effects (which, in turn, enable the spectacular growth shown above). For example, as more users join and use the network, word of mouth causes even more users to join, enabling the company to move more money over roughly the same infrastructure, earning more fees without a matching increase in expenses. The company then has cash to continue its expansion.
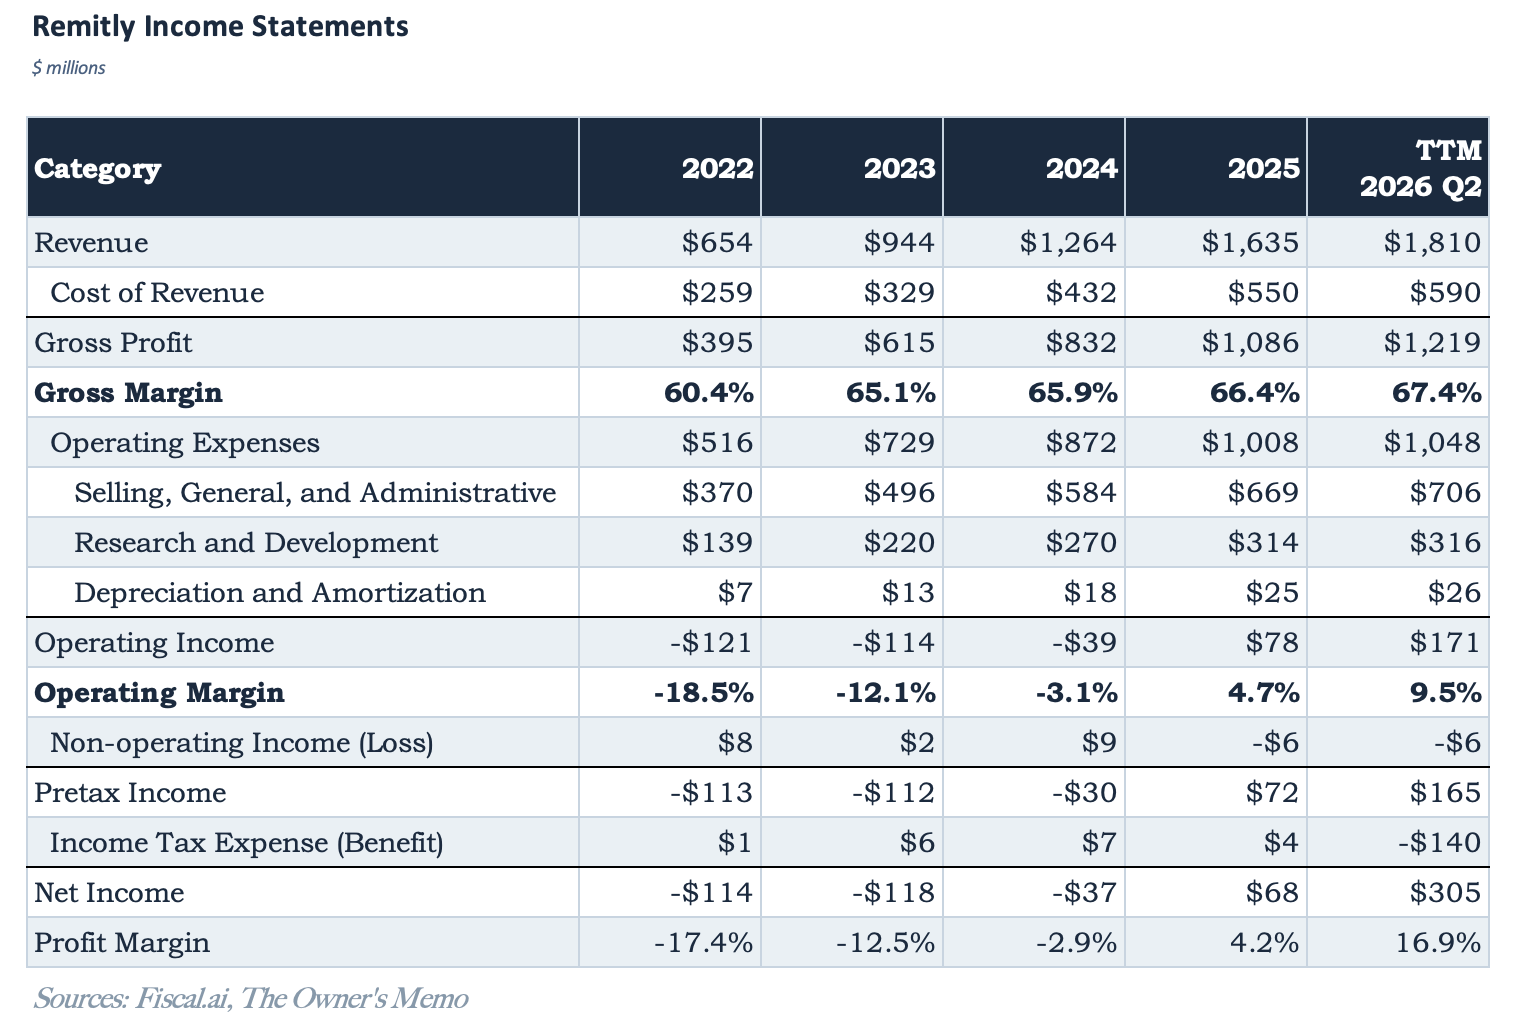
These scale economies and the resulting operating leverage are the reason Remitly showed up on our screen, of course, and you can see them succinctly in the company’s income statements from the past few years.
There are risks associated with the business too, and the most significant seem to surround competition and the fear that it will eat into Remitly’s ability to grow. The company Wise is a digital remittance provider, like Remitly, and provides its services at a lower overall take rate than Remitly does. However, there are reasons to believe that each company is primarily going after a different segment of the remittance market, Remitly mainly after the lower-volume senders with some need for physical cash, and Wise after higher-volume senders without much physical cash need.
Neobanks, like Nubank, which just announced an expansion into the US and a digital remittance business, also pose a threat to Remitly, as does potential competition from stablecoins. My working hypothesis at the moment, however, is that customer-company relationships involving money movement and management are sticky to an extent because they involve trust. It may be the case that each of these new digital remittance providers is able to win market share, continuing to take it from the incumbents stuck in the past.
I’m reminded here a bit of Eddie Lampert’s investment in AutoZone in 1997, which I wrote a three-part series about. Lampert’s investment relied on a similar concept, that AutoZone was taking market share in the retail automotive parts business from old incumbents, both small mom-and-pop stores and larger, unfocused ones like Sears. But AutoZone, too, had a “modern” competitor at the time, O’Reilly Auto Parts. Would one company eat the other’s lunch? In time, it became clear that there was room for both AutoZone and O’Reilly to take market share over a long period. Both did it too, by the way, while benefitting from economies of scale and operating leverage.
Remitly may be a similar story.
The stock trades at a pro forma P/E of approximately 26 times on annualized and normalized recent quarterly results.1 With a multiple like that, the stock is not obviously “hit you over the head with a two-by-four” cheap, but if growth continues with operating leverage (as it should), it may be. I will be doing further work on the company’s competitive dynamics to assess its ability to continue to grow, which could make today’s price compelling.
Toast (ticker: TOST)
Toast is a software company that provides restaurants with a technology platform upon which to manage their business. Management describes the company’s software as a “restaurant operating system” that handles payment processing and connects servers at the “front” of the restaurant to staff at the “back” and supports dine-in, takeout, delivery, catering, and retail. The company also provides restaurants with hardware to do things like taking orders and payments, enabling smooth operations.
The stock trades at a market cap of $18.3 billion and a per-share price of $31.69, as of October 19, on 578 million shares outstanding.2
The company has expanded rapidly since it was founded in 2011, and now does business in 180,000 restaurant locations as of Q2 2026, mainly in the US.
The charts below highlight the company’s growth in both locations and the volume of payments running through its platform.
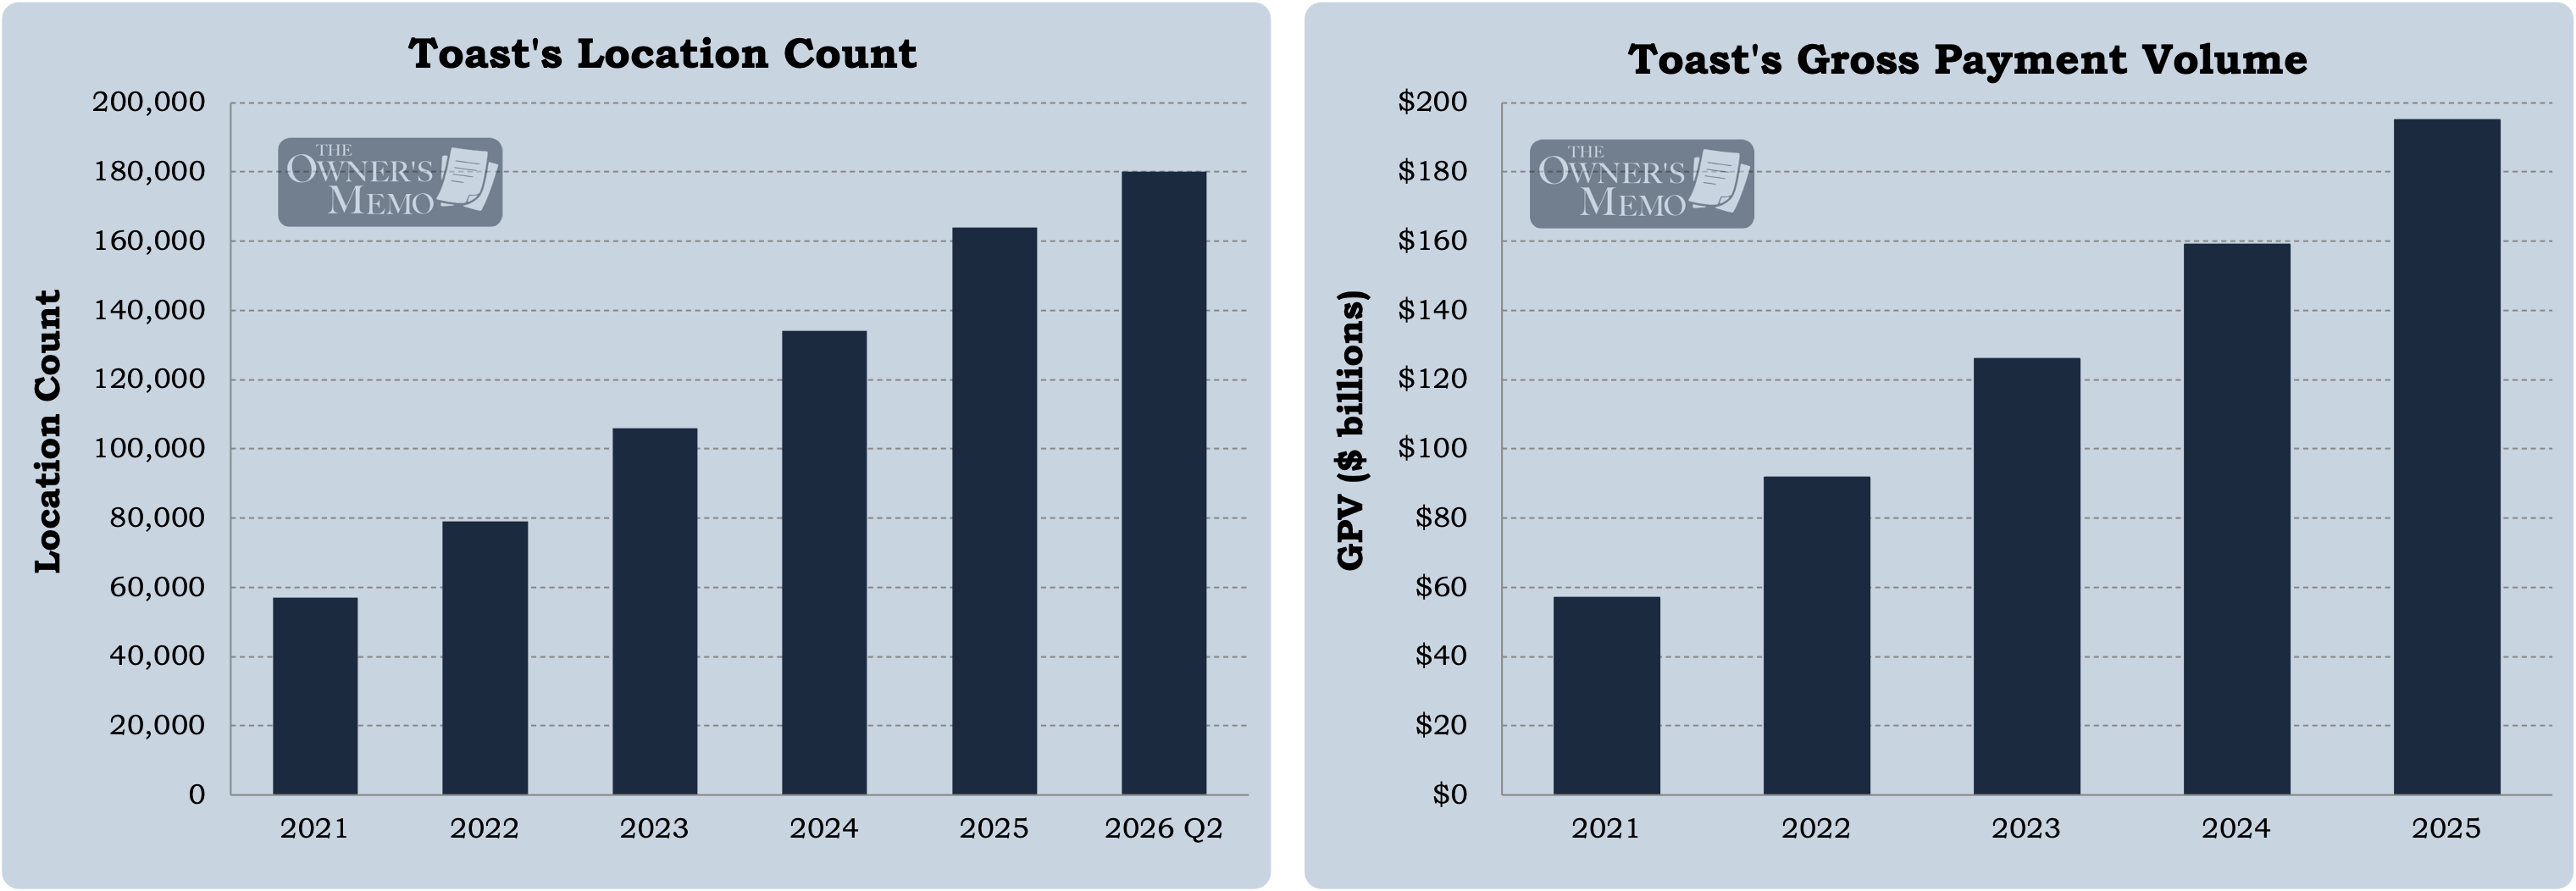
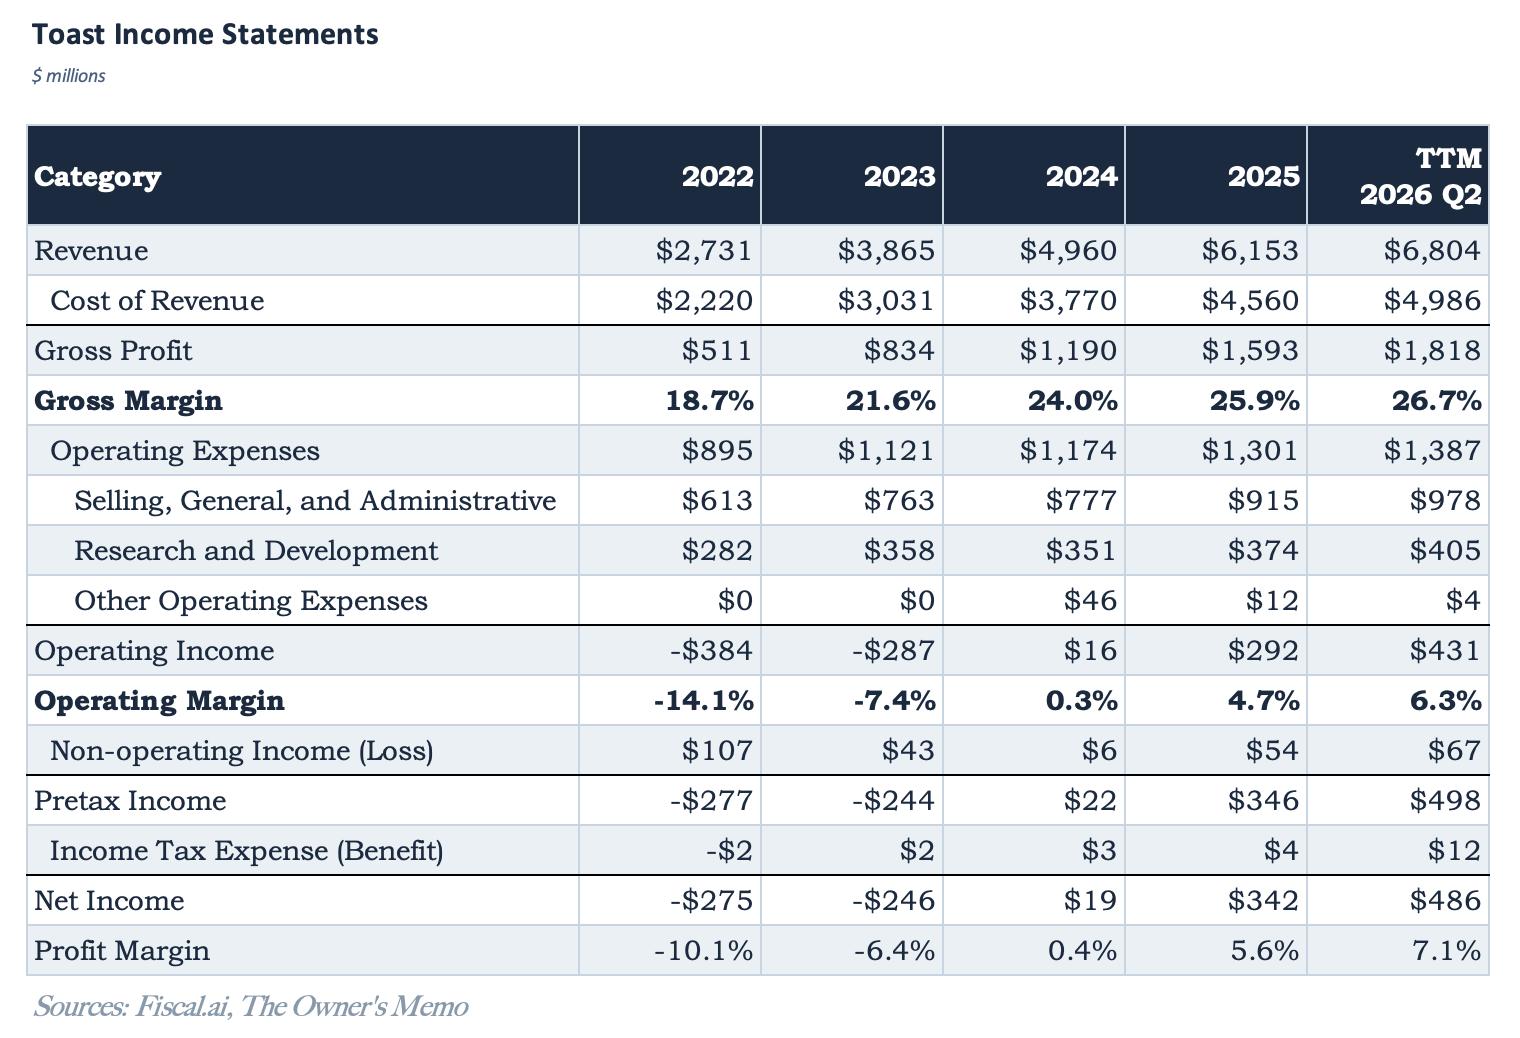
Toast, like Remitly, is a company that benefits from operating leverage as economies of scale kick in with higher and higher revenues. As the company onboards new restaurants, some expenses like research and development costs can be amortized over a larger revenue base (like many software companies), and word of mouth helps to reduce the amount of marketing spend needed to bring on each new restaurant.
The operating leverage is visible in the company’s income statements. It results in both gross and operating margins increasing over time, as you can see below.
Toast is not without risks. It has grown rapidly, as mentioned. In its 2025 10-K report, the company estimated that it was doing business with approximately 20% of the US restaurant market. It competes with both older, established products, like Aloha from NCR Voyix, MICROS/Simphony from Oracle and Global Payments’ products, as well as more modern offerings, like Clover from Fiserv and Square from Block.
Expanding to more restaurants will be even more competitive than in the past since Toast no longer has a small market share from which to start. Today, the majority of their customers are small- and medium-sized businesses, and Toast may attempt to capture larger players (think Starbucks or McDonald’s or Jersey Mike’s Subs3) which could come with worse economics. On the positive side, Toast has a very small presence outside the US and plans to expand internationally.
Management seems to have good discipline with respect to capital allocation, having started their first meaningful amount of share repurchases in 2026. They repurchased 18.42 million shares at an average price of $26.39 per share ($486 million total) in the first half of 2026, versus a stock price of $31.69 as of October 19. Even after the repurchases, the company has $1.7 billion of cash and cash equivalents on its books.
With a market cap of $18.3 billion and pre-tax income of $162 million in the June 2026 quarter, Toast trades at a normalized P/E around 38 times today.4 A valuation like that is far from obviously cheap, but Toast has such a strong product and market position, that some amount of continued revenue growth is inevitable, and operating leverage should result in operating income rising even faster than revenues. The valuation today is obviously very sensitive to the amount of growth Toast can manifest in the future.
Both Toast and Remitly are already showing the operating leverage that is carrying each company from a low ROIC bucket to a higher one. Whether either completes that journey, and whether today’s price already reflects it, depends on how long each can keep growing. That is where my further work on both will focus.
Disclaimer
The Owner’s Memo is published for informational and educational purposes only. Nothing here is investment, legal, or tax advice, or a recommendation to buy or sell any security. The content is general and does not consider your individual circumstances, objectives, or risk tolerance. I am not a registered investment adviser or broker-dealer.
I may own positions in securities I write about, and I disclose any position at the time of publication. My views may change without notice, and I have no obligation to update prior posts.
Investing involves risk, including loss of principal. Past performance is not indicative of future results. The information here comes from sources I believe to be reliable, but I make no guarantee of its accuracy or completeness. Do your own research and consult a qualified professional before making investment decisions.
The P/E of 26 times is calculated by taking the company’s market cap of $5.17 billion, operating income of $66.7 million reported for the June 2026 quarter, annualizing it ($266.8 million), and then tax effecting that number at a 25% tax rate to arrive at $200.1 million of earnings. The 25% tax rate may be too draconian, since the company receives research tax credits and since it carries $191.9 million of NOLs as an offset to US federal taxes, but I thought it directionally correct and a good, if conservative, long-run estimate.
Note also that Remitly’s Q2 GAAP net income was $305 million, which is abnormally high due to a $140 million one-time tax benefit.
Toast has a dual-class structure consisting of 514 million Class A shares and 64 million Class B shares, which share equally in the economics. In governance and voting matters, Class B shares have ten votes per share, and Class A shares have one vote per share.
A friend recently visited me from out of state. We saw a Jersey Mike’s store, and he said “All those Italian delis in New Jersey. Why would you need Jersey Mike’s?” It’s a good point.
The P/E of 38 times is calculated by taking Toast’s market cap of $18.3 billion, pre-tax income of $162 million reported for the June 2026 quarter, annualizing it ($648 million), and then tax effecting it at a 25% tax rate to arrive at $486 million of earnings. Toast has had a very low effective tax rate over its life. In 2025, for example, the company’s tax rate was reduced by 20 percentage points by share-based compensation. That is a benefit allowed to Toast (and other companies) based on the value of stock awards when they vest.